| AMM7 with Data Assimiation | ||||
|---|---|---|---|---|
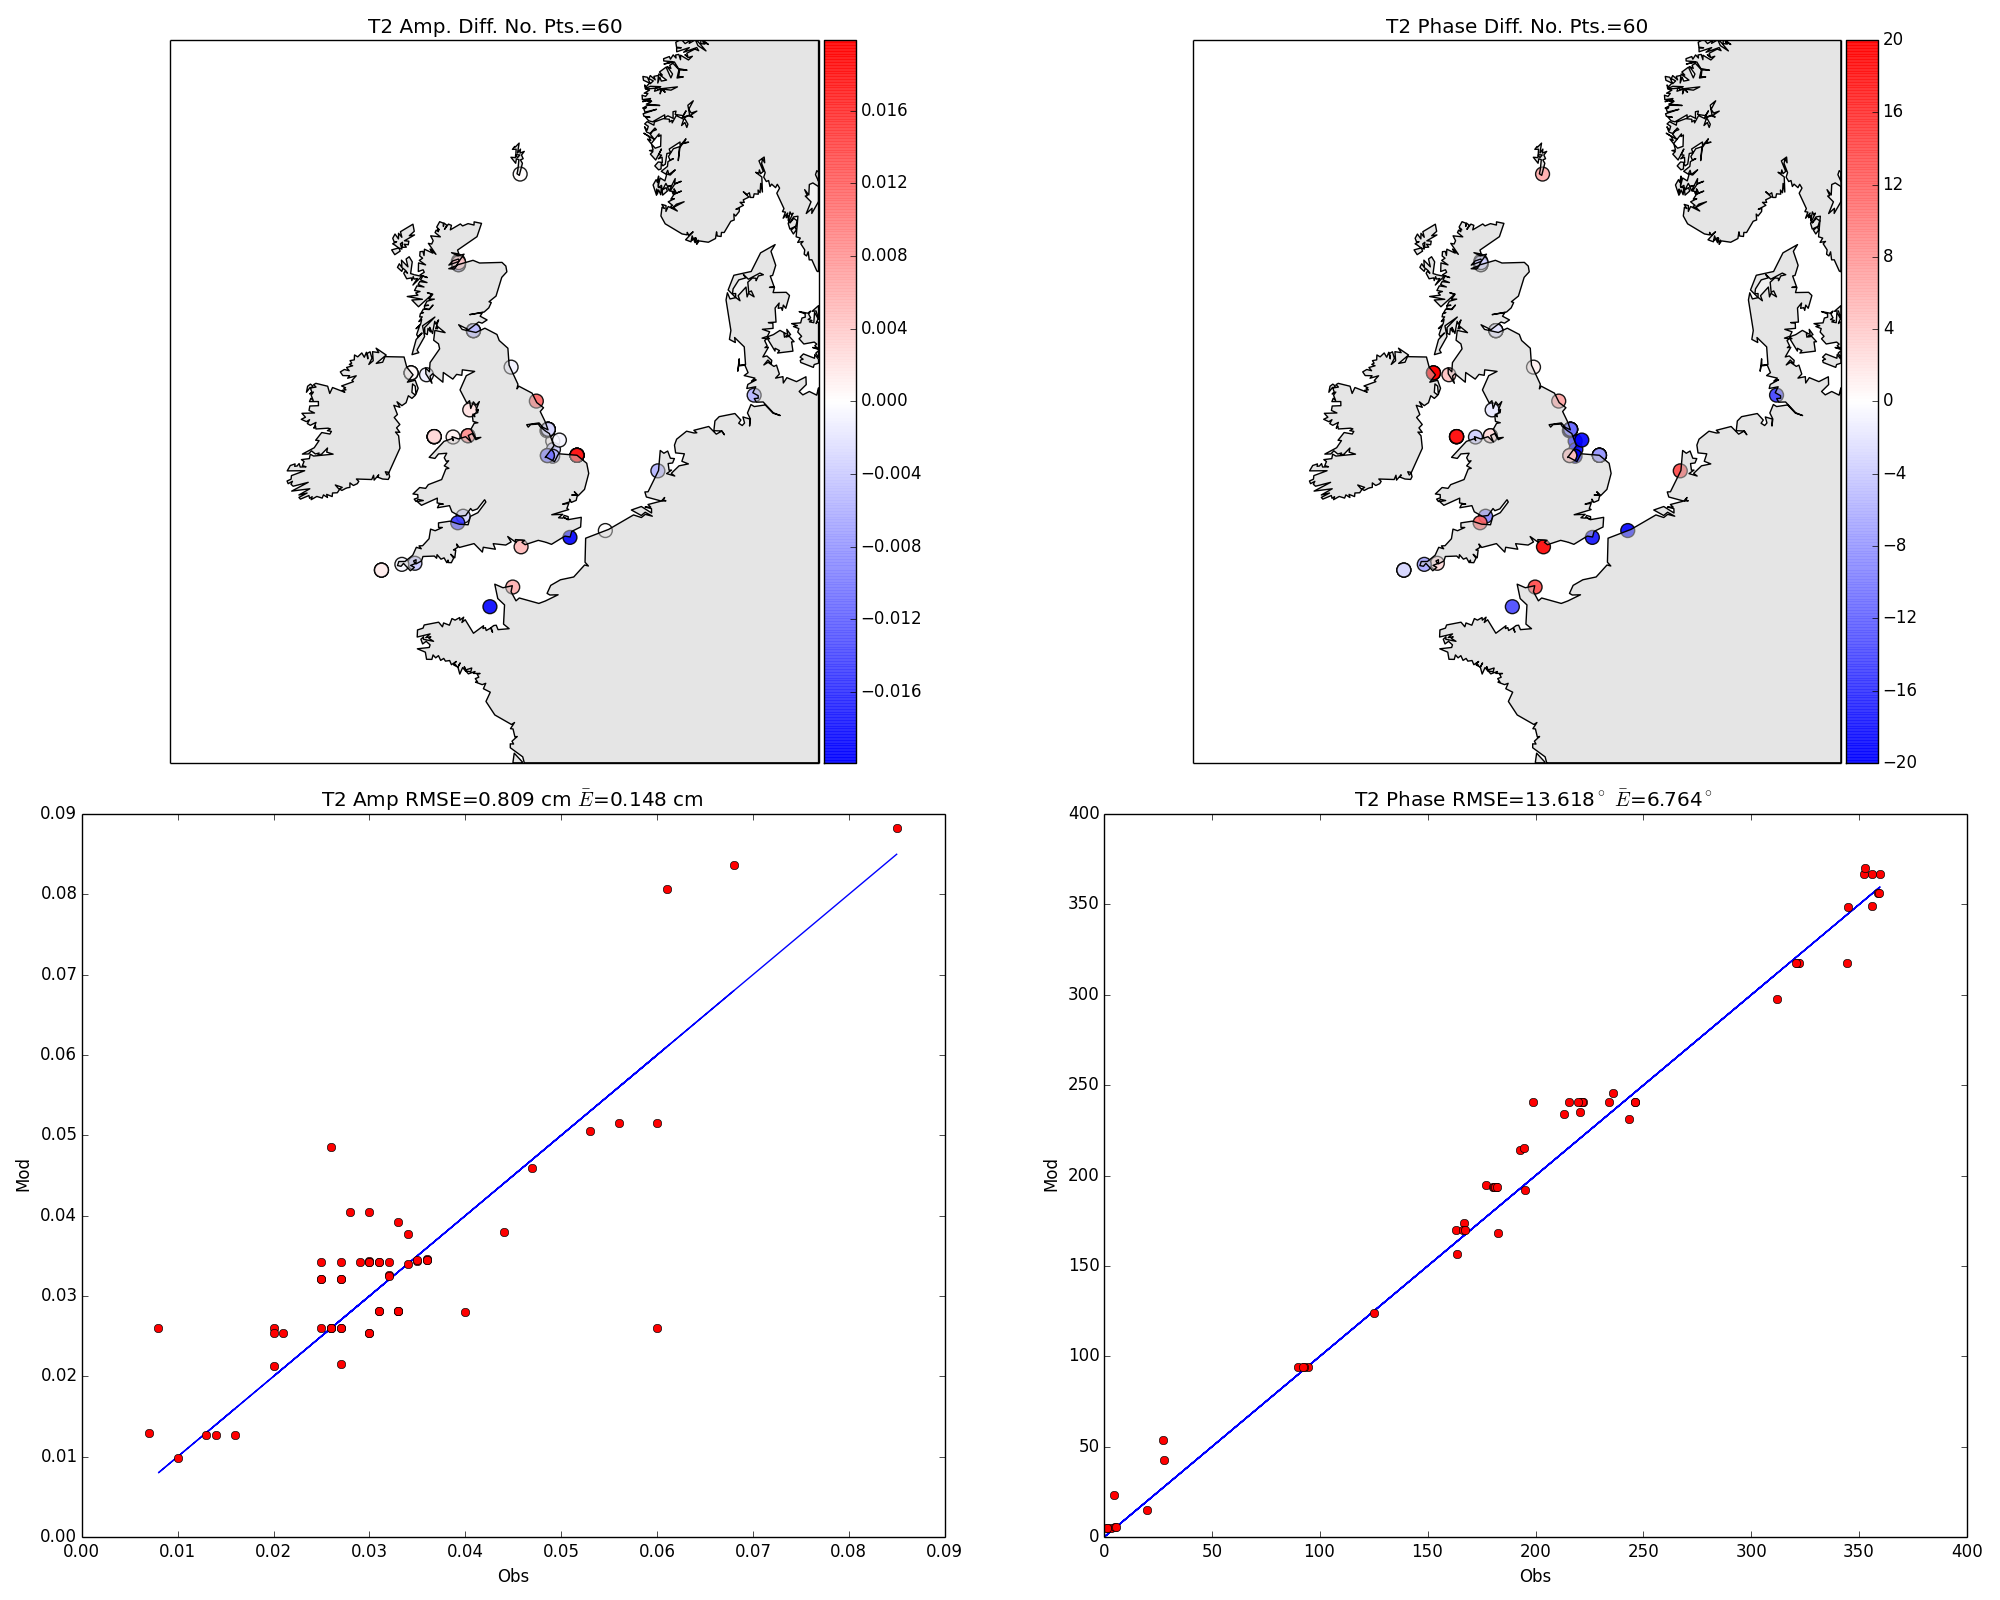 T2 |
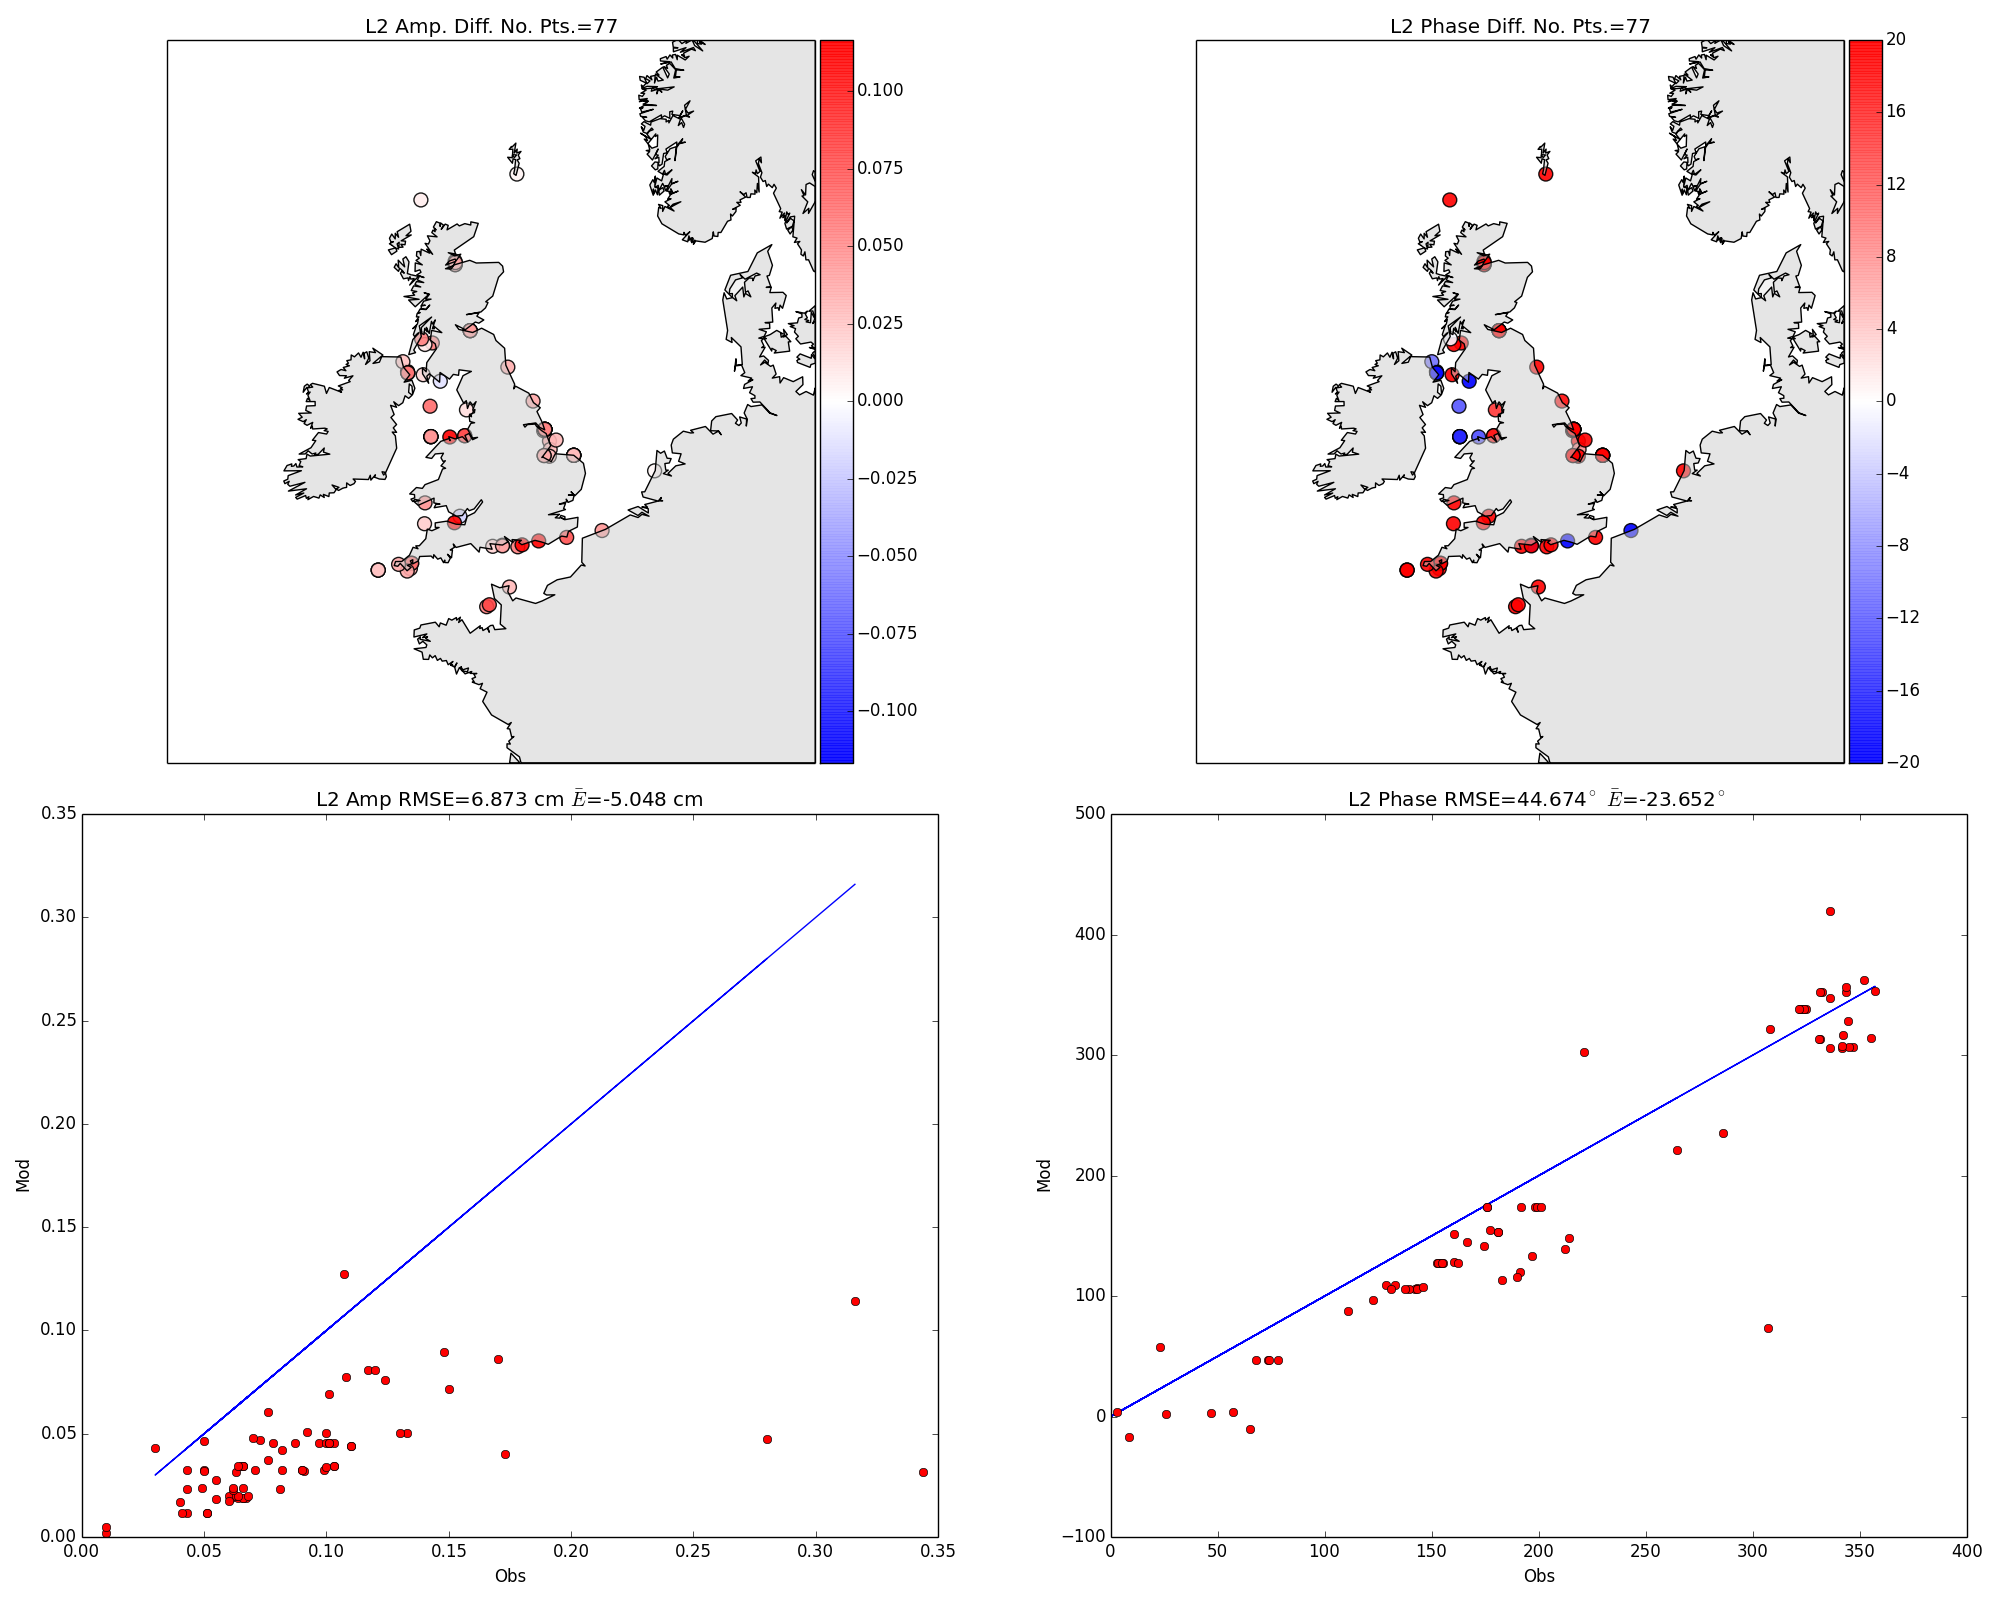
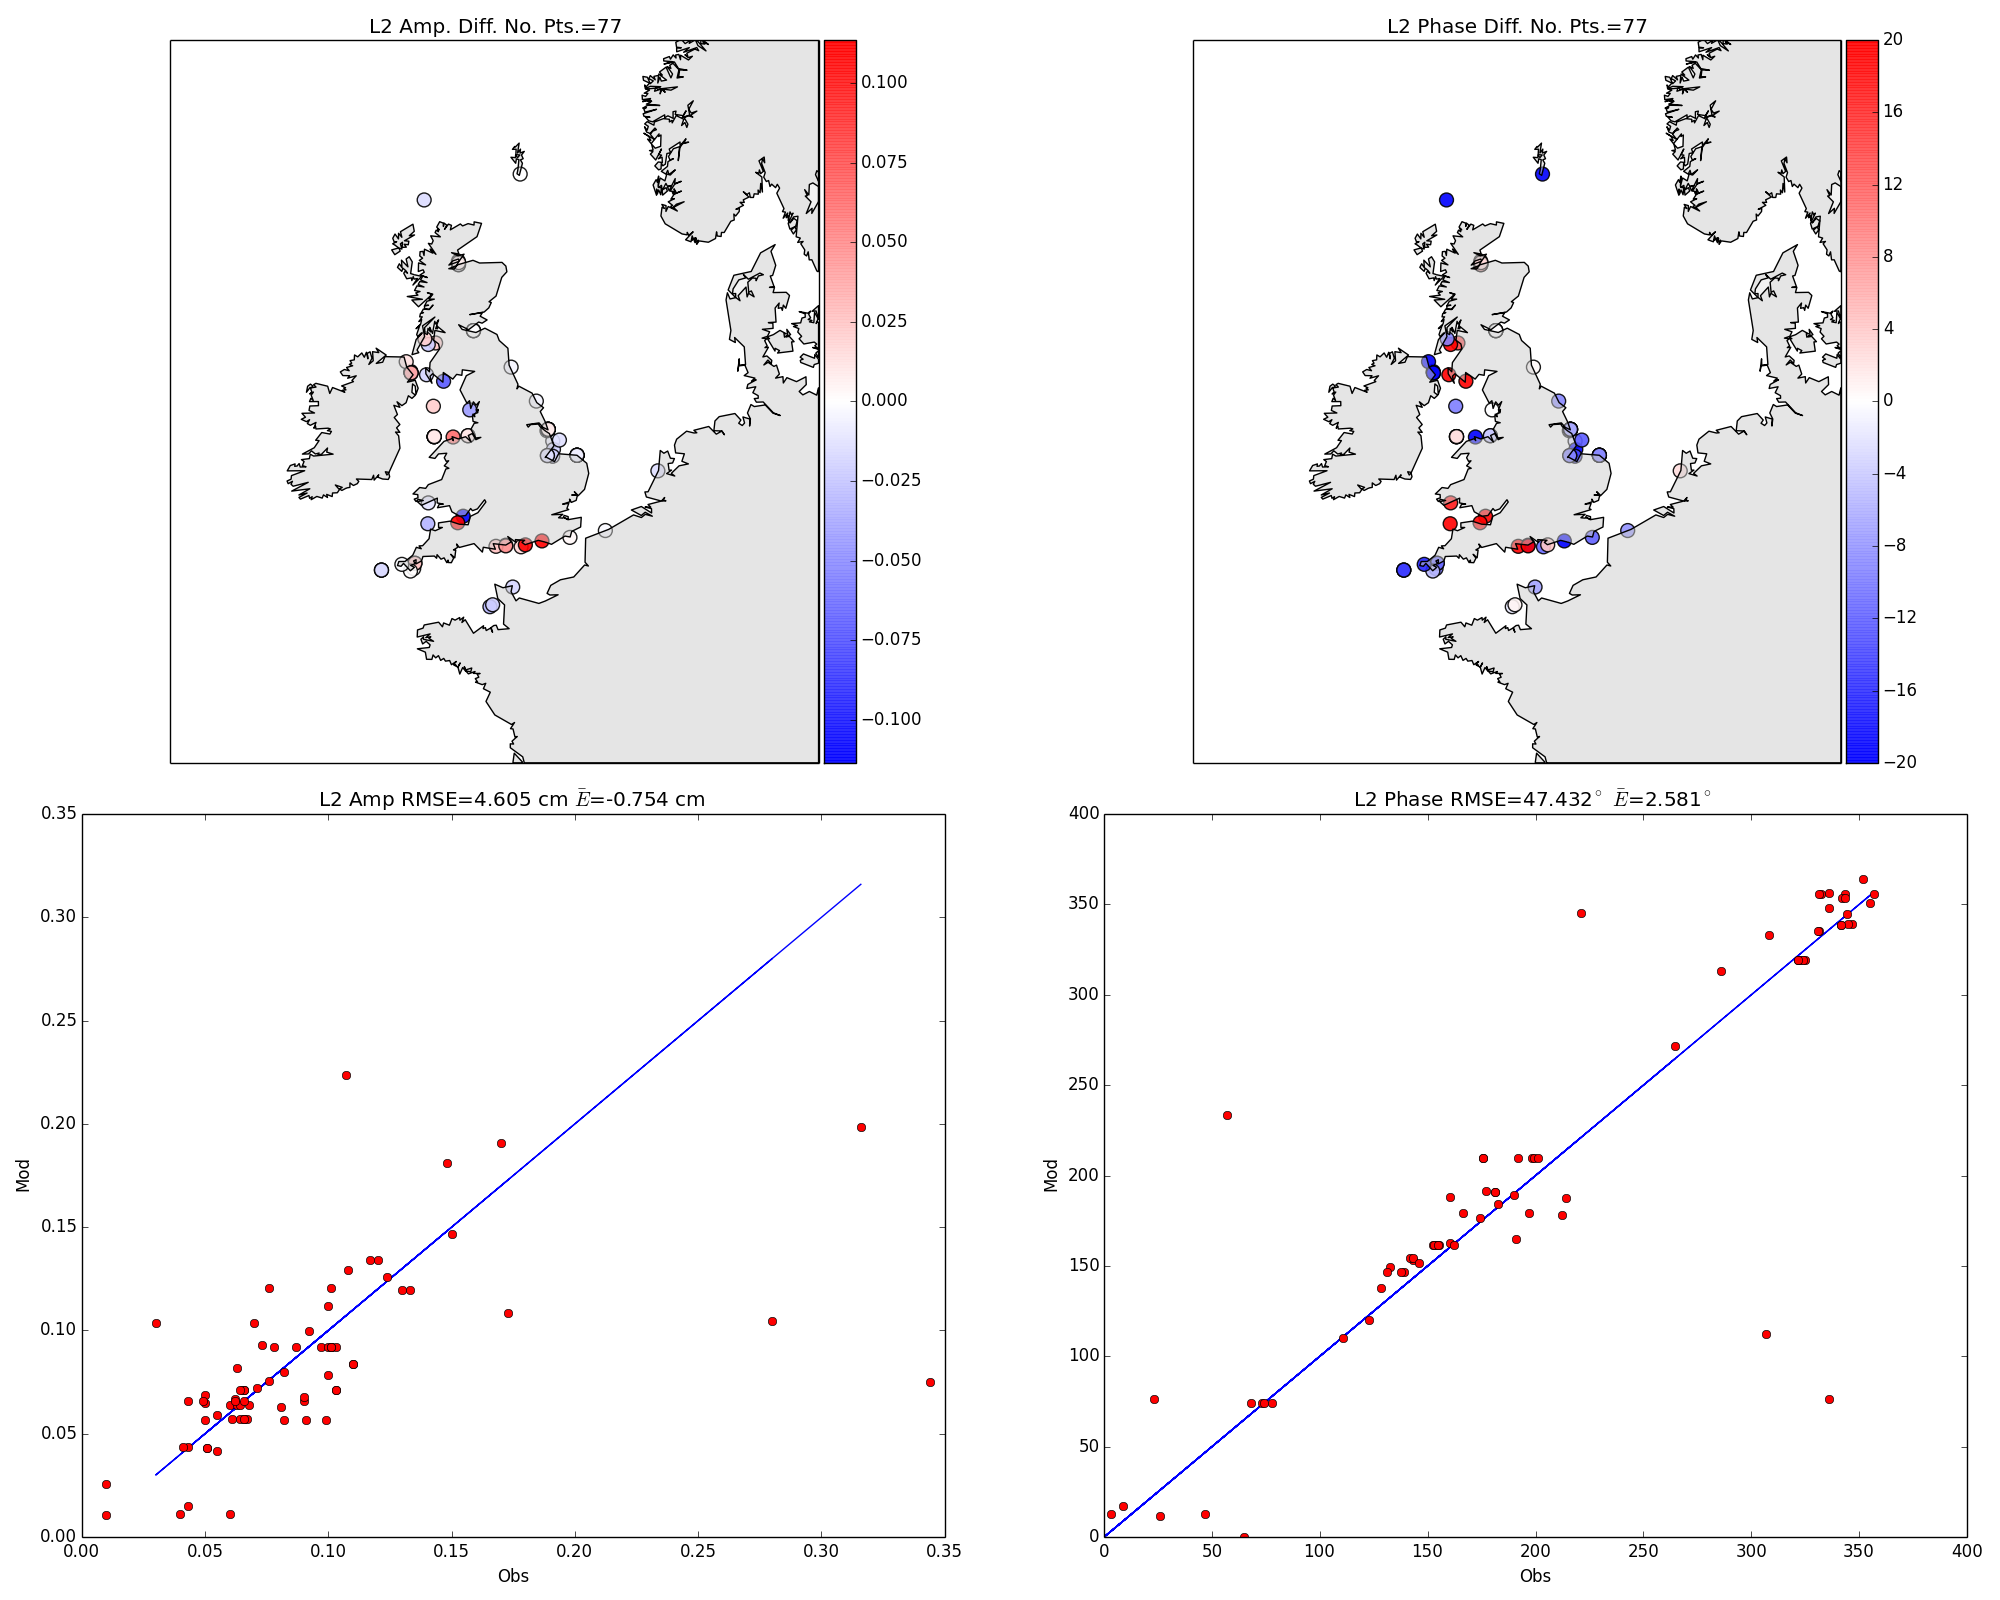 L2 |
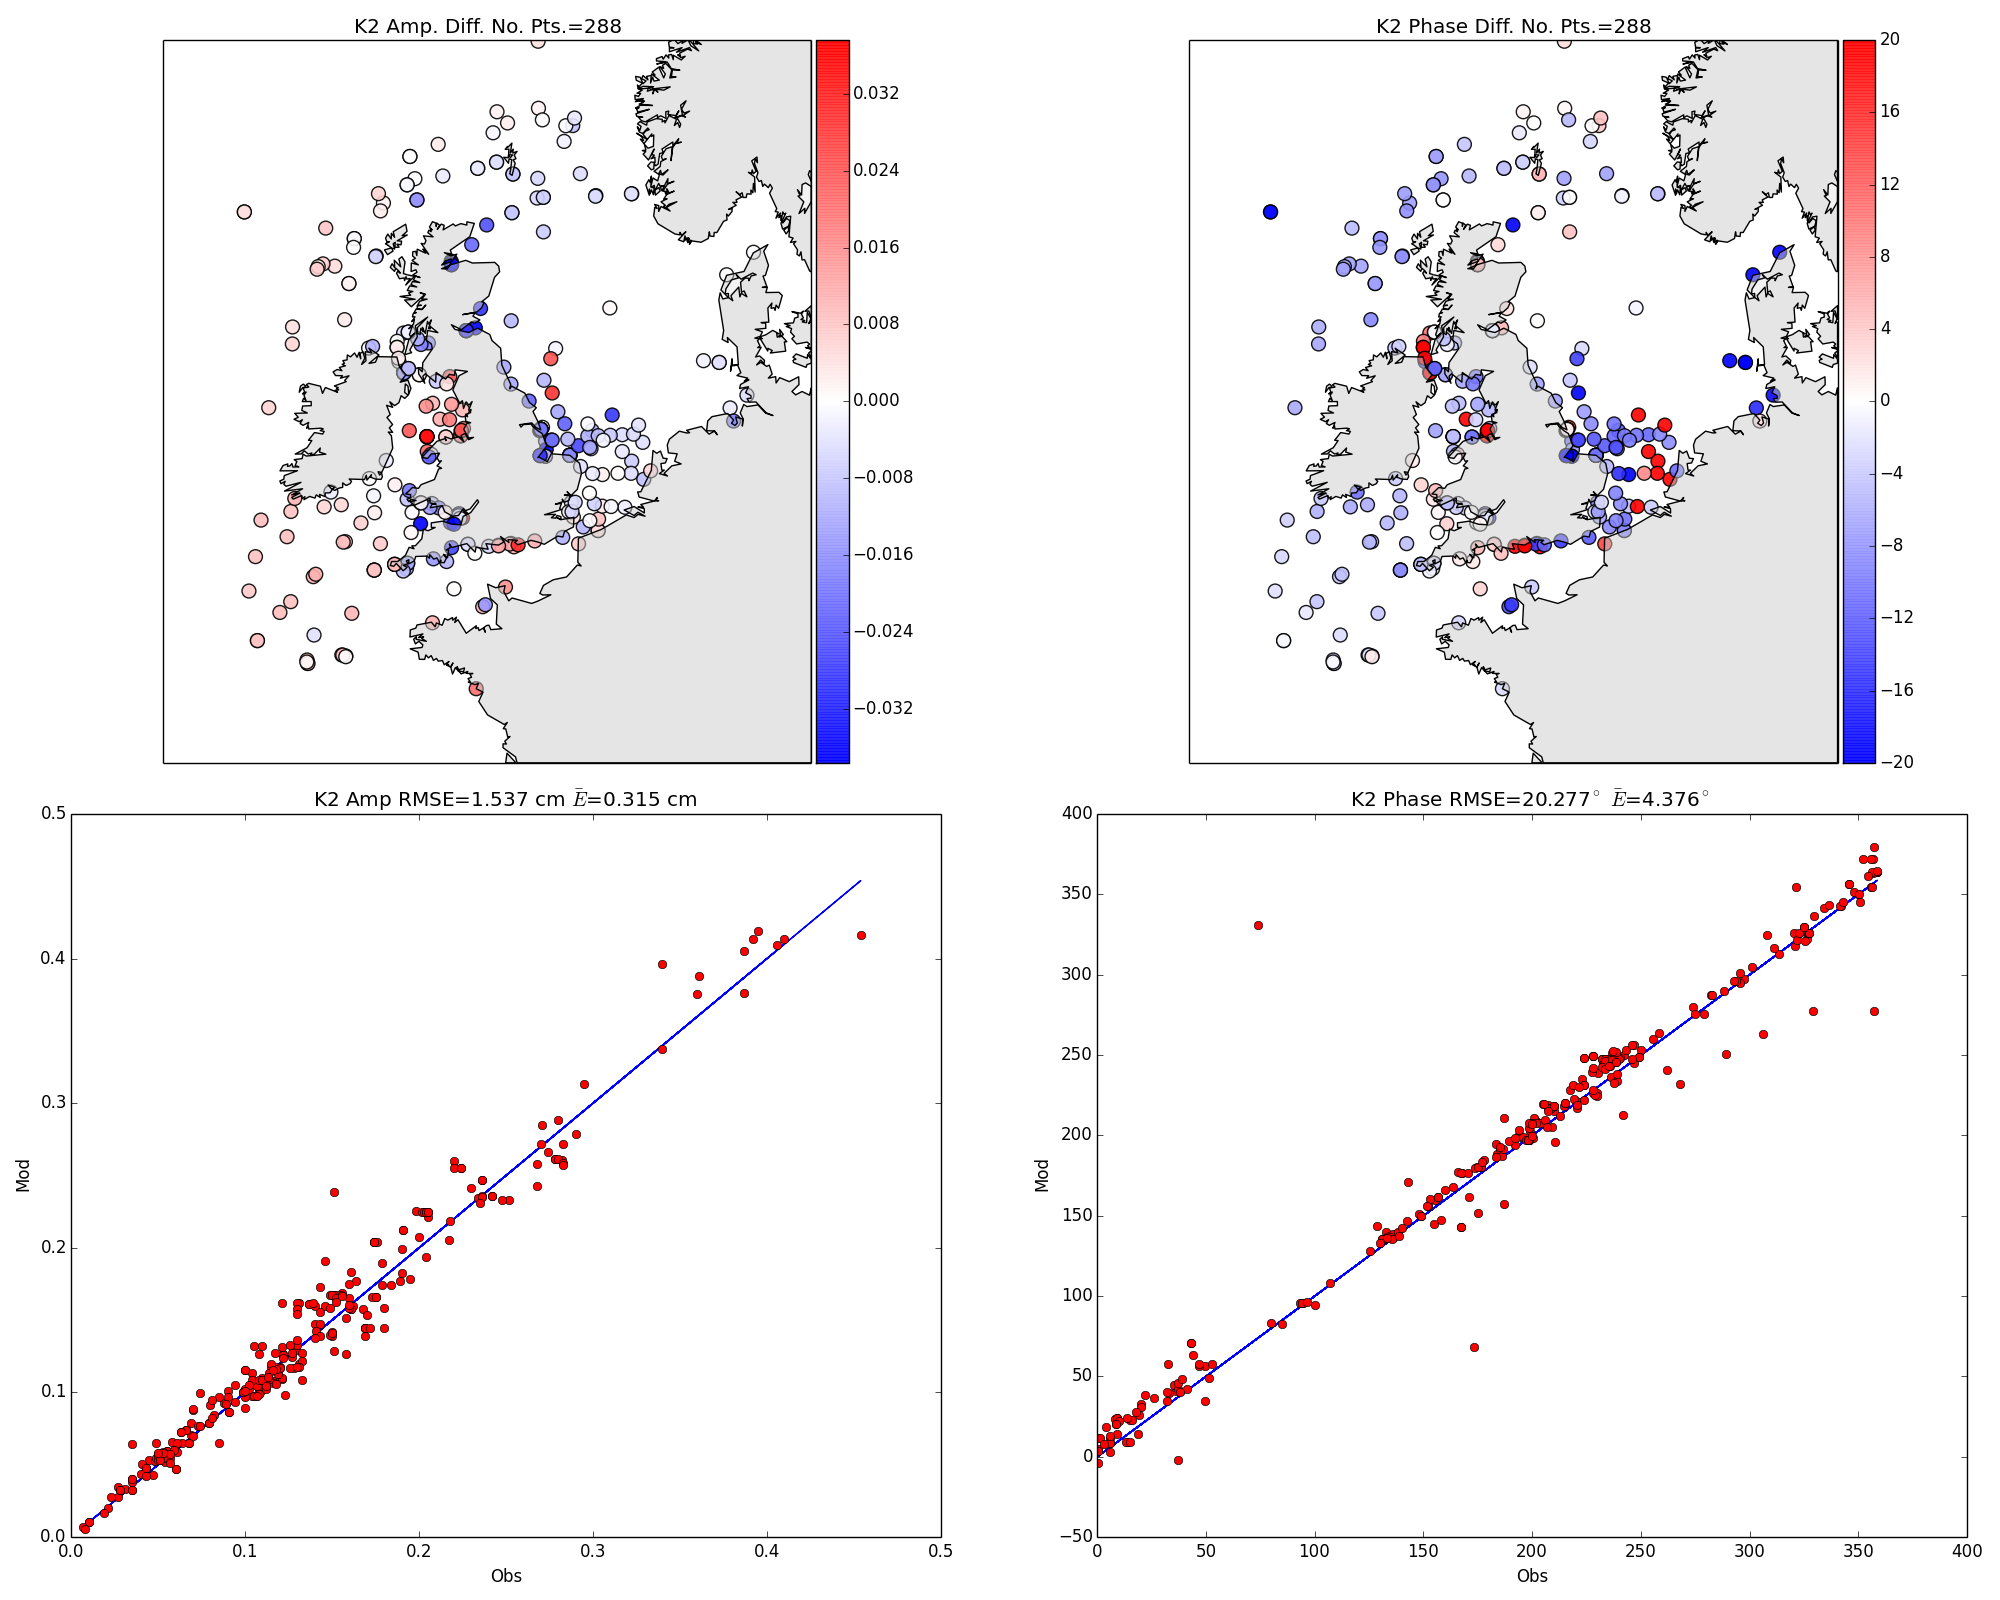 K2 |
||
| AMM15 with Data Assimiation | ||||
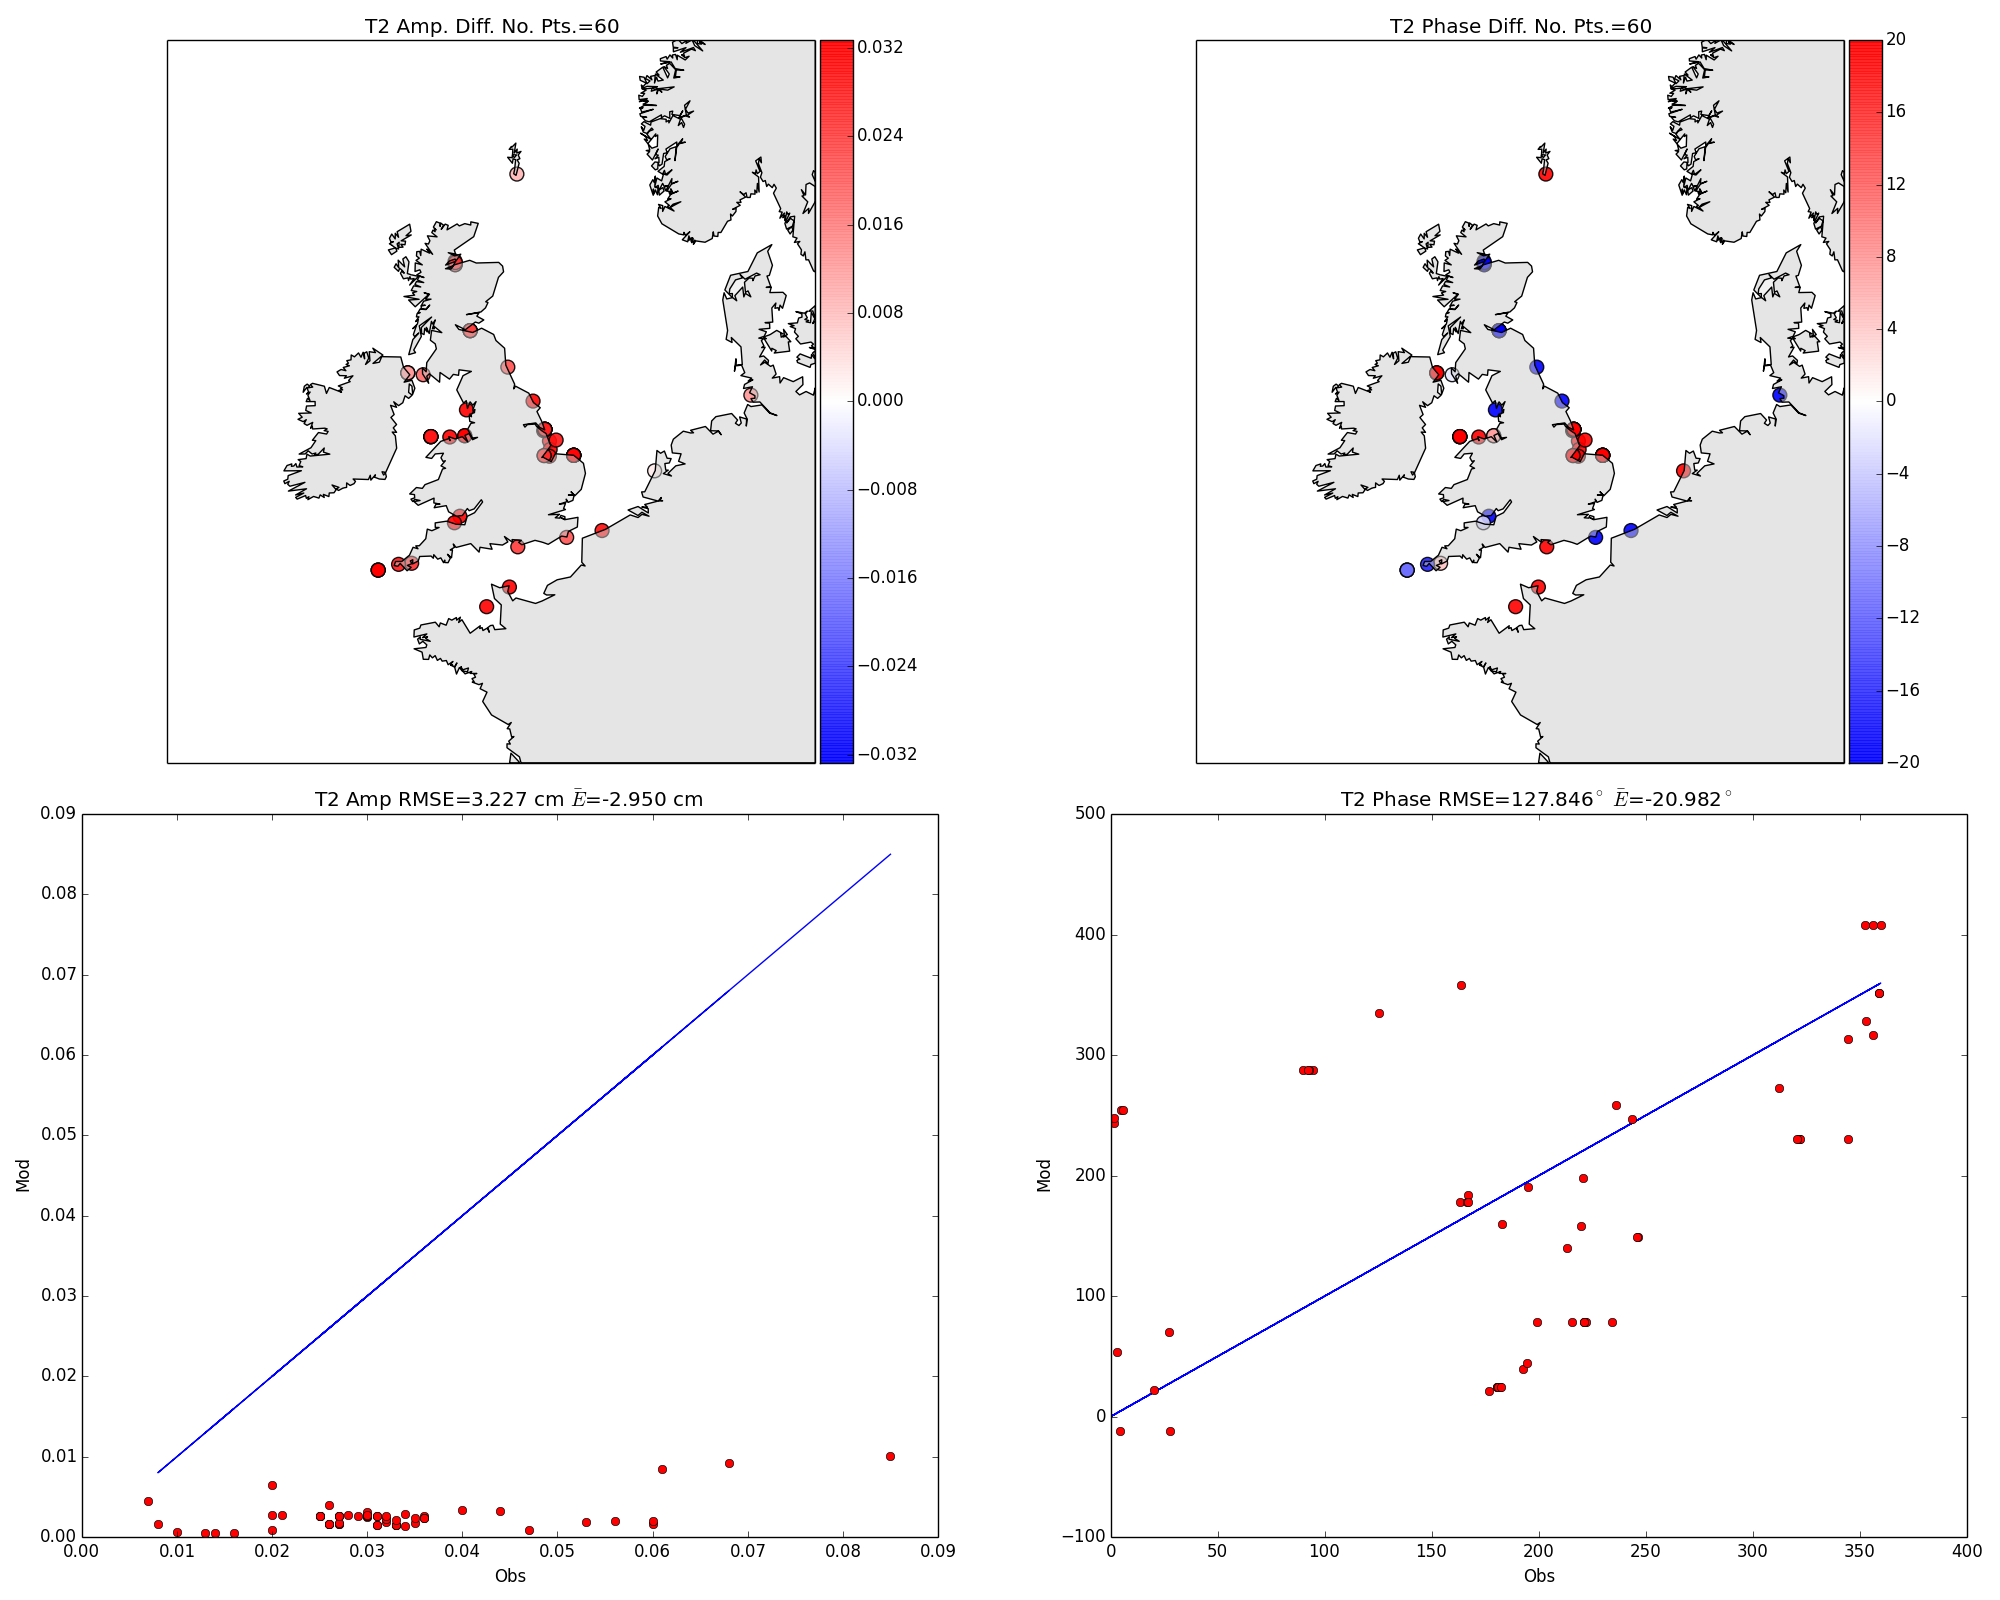 T2 |
 L2 |
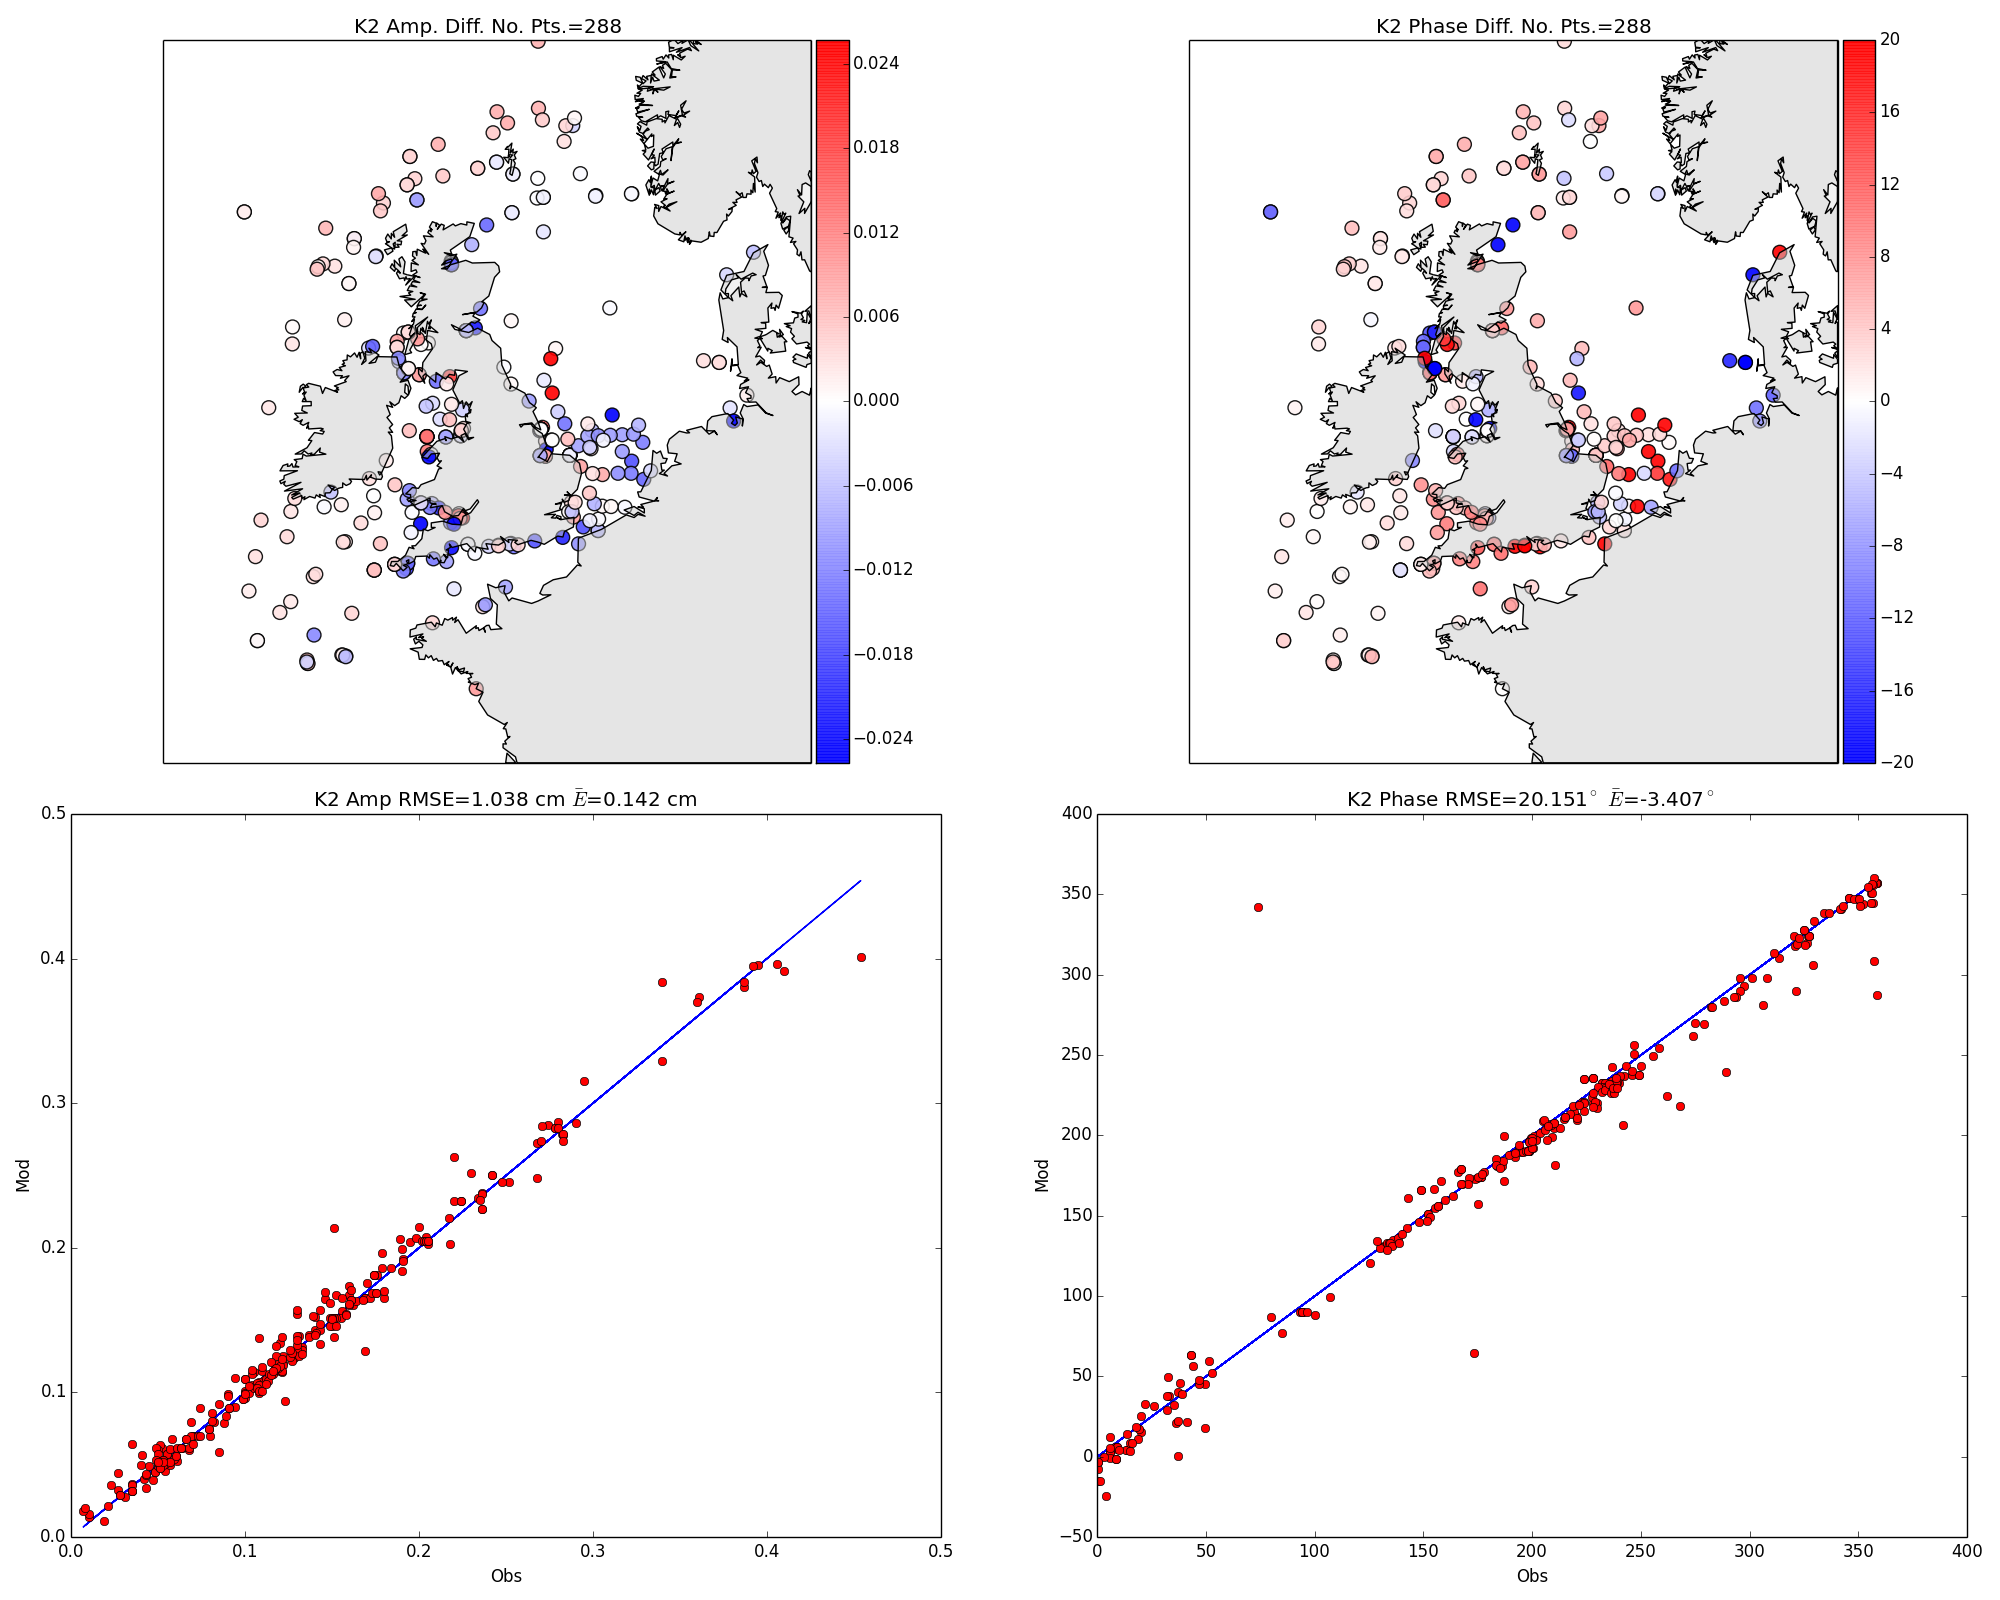 K2 |
||
Bottom subplots: Scatter plot of model (y-axis) vs Observations (x-axis)