Water level in the Stettin Lagoon
Cooperative work between the German Baltic sea level service at the BSH and the Polish sea level service at the IMGW in the context of the border waters commission, 2014.
General description
The forecast of water levels in the Szczecin Lagoon, the eastern part of which is under Polish jurisdiction and the western part under German jurisdiction, is carried out by both the German and Polish services for water levels. Due to the connection with the Baltic Sea, the water level is influenced by the water level on the outer coast, but as the connection is quite limited, there is also a great influence of the local atmospheric conditions on the water level.
Here we give a characterization of the water level in the lagoon subdivided into four categories representing the most common types of water level development in the region. These four types are then represented by several selected cases. The four categories representing the most common types of water level development in the region are:
1) High water levels on the outer Baltic coast and in Szczecin
Lagoon
(November 1978, November 1995, October 2009)
2) Large difference between the outer Baltic coast and Szczecin Lagoon
(October 1986, November 1992, February 2002)
3) Large difference within Szczecin Lagoon
(April 1995, March 2001, October 2002)
4) Low water levels on the outer Baltic coast and in Szczecin Lagoon
(December 1977, October 1991, January 1993)
There is also a fifth category representing almost flat conditions with little geographic variation. Although this category is quite common, especially during summer, no attention is given to this possibility, as it is not of larger importance in the context of the sea level services.
For the selected cases a short description of the meteorological condition and of the related development of the water level in the lagoon is given. The general Influence of wind conditions on water level fluctuations in Szczecin Lagoon and on the outer Baltic coast (6 Bft or more, with Karnin and Ueckermünde representing the western part, and Trzebież the eastern part) is given in table 1.
High sea levels on the outer Baltic coast and in the Szczecin Lagoon occur mainly during strong N-NE winds. The exchange of water takes place mainly via the Swina River (75%). Due to the geographical position of the Swina River (mouth in NE direction), this wind direction causes the smallest time lag in the rise of sea levels between the outer coast and the Szczecin Lagoon (e.g. in November 1995). In October 2009, water levels in Szczecin Lagoon and on the outer coast rose almost simultaneously (although water levels in the lagoon had already risen). Water levels on the outer Baltic coast fall faster than in the Szczecin Lagoon, where they continue to rise for some time before starting to fall slowly. This is due to the almost closed system of the lagoon.
E and SE winds do not have a major influence on water levels on the outer Baltic coast. SE winds cause falling water levels in the eastern part of the lagoon, and the water surface in the lagoon has a slight east-west slope (March 2001).
Table 1: Influence of wind conditions on water level fluctuations in Szczecin Lagoon and on the outer Baltic coast (6 Bft or more, with Karnin and Ueckermünde representing the western part, and Trzebież the eastern part)
|
Wind direction |
Outer coast |
Szczecin Lagoon |
|
N-NE |
High water levels |
High water levels in the entire Lagoon |
|
E |
No influence |
Elevated levels in the western part of the Lagoon, lower levels in the eastern part |
|
SE |
Levels falling slightly |
Lower levels in the eastern part of the Lagoon |
|
S |
Low water levels |
Low levels in the entire Lagoon |
|
SW |
Low water levels |
Lower levels in the western part of the Lagoon; Slight back-up in its eastern part |
|
W |
No influence |
Elevated levels in the eastern part |
|
NW |
High water levels |
Lower levels in the western part; Slightly elevated levels in the eastern part |
S-SW winds cause low water levels on the outer Baltic coast and in the Szczecin Lagoon. During SW winds in the Lagoon, water levels in the western part of the Lagoon are lower than in the eastern part, and water backs up in the eastern part (October 1991, January 1993). Strong water level fluctuations, such as those observed on the outer coast in January 1993, do not occur in the Szczecin Lagoon due to the damping properties of the almost closed lagoon system.
Westerly winds do not affect water levels on the outer coast. Inside the lagoon, this wind direction causes the water surface to rise from west to east (e.g. in October 2002). As the wind pushes water masses into the eastern part of the lagoon, the water levels in the western and eastern parts of the Szczecin Lagoon can differ by up to 1 meter.
November 1978: High water levels on the outer Baltic coast and in the Szczecin Lagoon
Meteorological situation
At the end of November 1978, the weather around the Baltic Sea was the result of the interaction of two large pressure systems. In the north of the European continent, a strengthening anticyclone was located. Its elongated center, above 1040 hPa, extended southwestward from the Kola Peninsula and northern Finland to central Sweden. Its southwestern wedge covered England, the North Sea, and Denmark with values above 1020 hPa. Over southern Europe, a large trough of low pressure refused to retreat in front of the advancing anticyclone. Within the trough, numerous successive secondary low pressure centers, accompanied by atmospheric fronts, moved northwestward from the Black Sea region across the Hungarian Plain toward the Baltic Sea. The Baltic Sea was on the edge of two colliding pressure systems: the cold anticyclone over northeastern Europe and the warm and humid trough over the southeast.
The anticyclone over Scandinavia intensified and expanded southward, the depressions tended westward, and the trough as a whole slowly shifted southeast. The pressure gradient over the Baltic Sea, especially near the southern and southeastern coasts, gradually steepened. As a result, the wind force in the coastal belt increased to gale-force and storm force, but decreased for short periods (and only over small areas when one of the successive secondary low pressure centers passed over).
On 27 November, one of the secondary low pressure centers reached the southern coast of the Baltic Sea. Near the Szczecin Lagoon, weak southwesterly to southeasterly winds influenced the coastal waters. As the center filled and entered the Latvian coast, the winds soon veered to northeasterly and northerly directions, became gusty, and increased again to gale-force, especially in the coastal area. Only in the early hours of November 30 did they begin to calm gradually in the southern parts of the Baltic Sea.
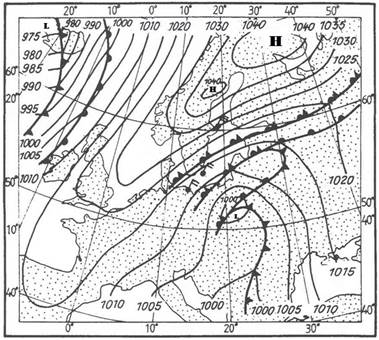
Figure 1.: Pressure pattern over Europe and wind field over the Baltic Sea on 29 November 1978 at 12 UTC
Development of water levels
Early on November 28, 1978, water levels were already around 530-540 cm. By noon, water levels had risen to about 550 cm in the lagoon and slightly higher on the outer coast. With intensifying onshore winds, the water level on the outer coast rose faster, and in the evening, the storm surge level (600 cm or 1 m above mean sea level) was reached at Koserow. The next morning, levels reached 630 cm, and remained at this level throughout the day, reaching a maximum of 633 cm at 23:30 UTC on 29 November. The rise of sea levels in the lagoon was less pronounced. There was an almost constant increase until the maxima were reached on 30 November at 05 UTC in Trzebież, 07 UTC in Karnin, and 12 UTC in Ueckermünde. By this time, water levels on the outer coast were already falling, falling below 600 cm around 13 UTC. In the lagoon, the fall was slower than on the outer coast, and levels below 600 cm were not reached until after 8 UTC on 1 December.
The storm surge was long lasting and characterized by a slow rise of water levels on the outer coast and in the lagoon due to the continuous onshore winds. At Koserow, water levels were above the warning level for about 40 hours. Levels above 600 cm were also recorded for a long time in the lagoon: 34 hours at Karnin, 35 hours at Ueckermünde, and 24 hours at Trzebież.
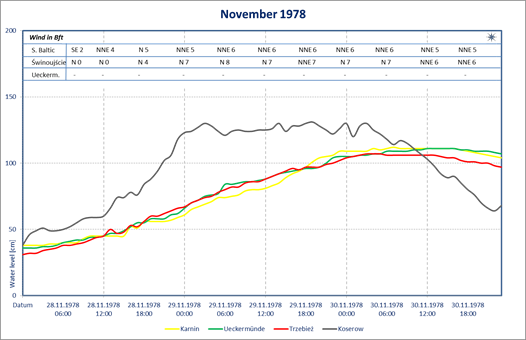
Figure 2: Development of water levels from 28-31 November 1978
November 1995: High water levels on the outer Baltic coast and in the Szczecin Lagoon
Meteorological situation
Over Scandinavia and the Baltic Sea persisted a widespread and flat depression with several weak centers. One of these centers, nearly stationary over Lappland, became more active and about 03 UTC on 2 November began slowly its way southwards along the eastern coasts of the Baltic Sea. Between 18 UTC on 2 November and 12 UTC on 3 November, still slowly deepening and meandering, the depression entered the coast west of Gulf of Gdańsk, aiming south. The very center of the depression, however, passed quite close, and then only somewhat east of the Pomeranian Bay and the Szczecin Lagoon. The depression was flat, with variable winds, however the pressure gradient on its rear over Scandinavia became menacingly steep, especially over Denmark, Kattegat and the Western Baltic Sea, where, about 09 UTC on 3 November, strong northerly wind arose, growing in force. In the following hours a northerly to northeasterly storm, force 6-8 Bft spread gradually east, covered the whole Baltic Sea, reaching force 9 Bft in the western areas, in the night on 3 November and in the morning on 4 November. The coasts which separate the Szczecin Lagoon from the Gulf of Pomerania got under the strokes of that storm short before noon on 3 November. The hitherto nearly calm to mild, mainly westerly wind veered sharply to northerly directions and the wind speed sprang rapidly to nearly 18 and soon to 20 m/s. Only towards noon on 4 November the winds began to gradually decrease there to 15 m/s, and since early on 5 November they scarcely exceeded 10 m/s. These speeds and directions persisted as long as to about afternoon on 5 November. Then, after backing southwest, they calmed to moderate ones. Recorded wind speed during this storm reached 22 m/s in Warnemünde, 28 m/s in Arkona, and 19-20 m/s in Świnoujście. Maximum recorded wind speed at the Western Baltic Sea on this night reached nearly 35 m/s.
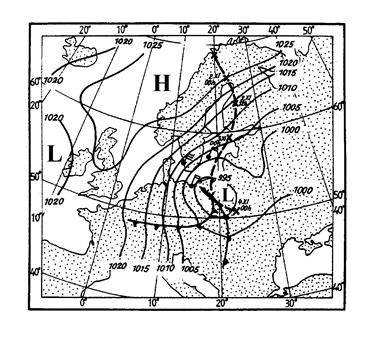
Figure 3: Route of the depression (from 00 UTC on 2 November to 00 UTC on 4 November 1995) and pressure pattern on 3 November at 12 UTC with accompanying wind field over southern areas of the Baltic Sea
Development of water levels
Water levels before the storm surge were about 30 cm above mean level. With the storm approaching, water levels began to rise towards noon on 3 November. In the afternoon the water levels at the Baltic outer coast rose quite quickly, reaching peak levels during the late hours of 3 November. The last measurement recorded at the Koserow gauge station before it was destroyed was 683 cm at 19:34 UTC. At Ruden, a gauge station west of Koserow, a peak level of 678 cm was measured at 21 UTC and the peak level of 669 cm at Świnoujście was recorded the next morning at 05 UTC. Water levels measured in the Lagoon began to rise in general, with a time lag of about 5-10 hours, in the evening of 3 November. The peak levels recorded on the morning of 4 November were 605 cm at Trzebież at 05 UTC, 615 cm at Ueckermünde at 07:10 UTC and 615 cm at Karnin at 07:30 UTC. At that time the water level at the outer coast was already falling due to somewhat weaker winds. But water level stayed quite high during the whole second half of 4 November and a constant fall, with higher rates at the outer coast and more damped in the lagoon, began only on 5 November. Water levels in the lagoon where above or around 600 cm for about 24 hours.
This storm surge was characterized by a rapid rise of water levels on the outer Baltic coast and by its long duration on the outer Baltic coast and in the Lagoon about than 24 hours, which was caused by persistent winds.
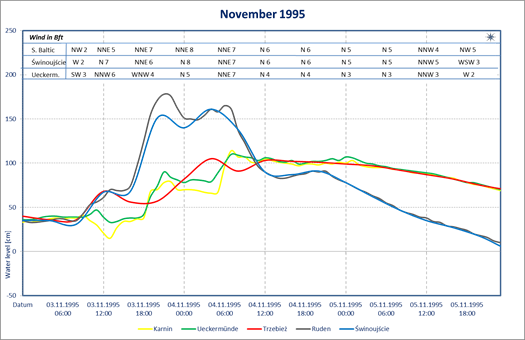
Figure 4: Development of water levels from 3-5 November 1995
October 2009 High water levels on the outer Baltic coast and in the Szczecin Lagoon
Meteorological situation
During the days preceding the storm over the Baltic several spacious low pressure troughs moved, coming from over the North Atlantic, eastwards onto the European continent. They were followed by a gradually strengthening anticyclone. The eastwards moving troughs were hindered on their further way eastwards by a powerful westwards spreading anticyclone over the West Siberian Plain. Thus, a reduced, stationary pressure zone formed and stretched archiwise from the Northern Ural Mountains over the central areas of European Russia, Belarus, Ukraine, Balkans and Turkey to the easternmost coasts of the Mediterranean Sea. Along the old meandering front system secondary low centers were alternately forming and decaying, some as deep as below 990 hPa. One of such secondary centers, which formed somewhat northwestwards of the Black Sea, moved quickly towards northeastern Poland. Between this low and the high over Southern Scandinavia, in which the pressure tended to 1035 hPa and later reached 1039 hPa, the pressure gradient over the Baltic Sea steepened as much as to generate a northerly storm already on 13 October. This storm reached hurricane-like wind forces, especially on the Southeastern Baltic Sea, on 14 October. The winds veered and calmed only when the anticyclone over Scandinavia shifted westwards to the British Isles, and the depression, staying stationary, filled over eastern Poland. Over the waters of the Pomerania and the adjacent Szczecin Lagoon northerly wind directions and moderate, growing strong winds were established already on 13 October. On 14 October the wind force oscillated between 7 to 8 Bft, exceeding these limits occasionally and calming only late on 15 October. When veering, early on 16 October the forces calmed slowly to 4-3 Bft.
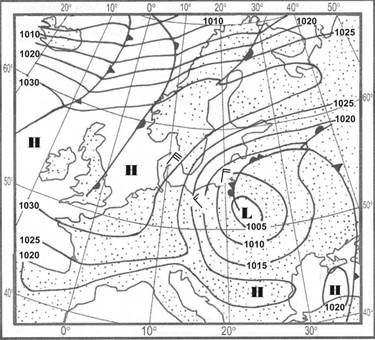
Figure 5: Pressure pattern and wind field over the Baltic on 15 October 2009 at 00 UTC
Development of water levels
The whole Baltic was well filled in the beginning of October (water level at Landsort on 5 October was 40 cm above mean sea level). At Ueckermünde measured water levels were between 530 cm and 550 cm since 6 October. With the arriving storm the onshore winds caused water levels to rise at the outer coast as well as, only with a slightly lower rate, in the lagoon. In the morning of 15 October the maximum water level was reached at the outer coast, 639 cm at Koserow at 05:21 UTC and 621 cm at Świnoujście at 05 UTC. With time lags of a few hours, peak levels were reached at Ueckermünde (624 cm at 08:17 UTC), Karnin (617 cm at 12:06 UTC), and Trzebież (626 cm at 12 UTC). In places this meant new record water levels. The high degree of filling in the Lagoon caused Odra water to be dammed back. On the outer Baltic coast, at Koserow, water levels exceeding 1 m above mean sea level persisted for about 26 hours. At the Ueckermünde gauge station, water levels exceeding the mean water level persisted for up to 34 hours. On the morning of 15 October, water levels began to fall on the outer coast, followed by slowly falling levels in the Lagoon in the afternoon.
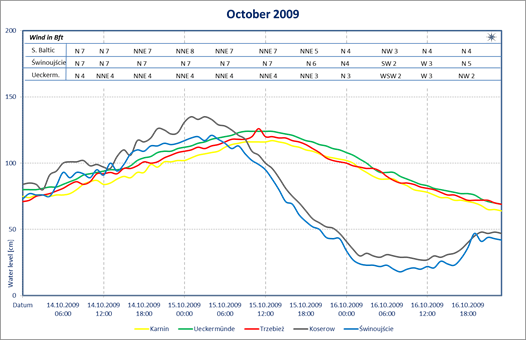
Figure 6: Development of water levels from 14-16 October 2009
October 1986: Large difference between levels on the outer Baltic coast and in Szczecin Lagoon
Meteorological situation
On 19 October moderate to light southwesterly to southeasterly air flow persisted over the whole Baltic Sea until 20 October afternoon, when an active low pressure centre, on its way from Ireland, crossed the English Channel and the southern North Sea. Moving close to the continental coast and still deepening, it arrived over the Southwestern Baltic Sea at about 21 UTC on 20 October. The pressure value in the centre was 973 hPa.
Before the approaching stormy center – which moved eastwards keeping close to the coast line – the winds backed to southeasterly and easterly, while further offshore, far as to they backed as northeasterly, and grew in force to 7 Bft. In the rear of the low, behind the occluded front, within a narrow zone of very steep pressure gradient, northerly to northwesterly storm, 8-9 Bft in places, stroke the southern coast of the Baltic Sea, beginning 21 UTC on 20 October. Gradually the onshore storm spread eastwards, meanwhile however the pressure gradient over Western Baltic Sea weakened. At 12 UTC on 21 October, the low pressure center (982 hPa) entered the Lithuanian coast and moved further east. The passage of the depression center with the occluded front over the area of the Szczecin lagoon occurred approximately between 03 UTC to 09 UTC on 21 October. The passage itself resulted in a sharp wind shift from southerly and east – southeasterly to northwesterly directions and in the growth of wind force, with exceeded 7 Bft at the outer shore and in the Pomeranian Bay.
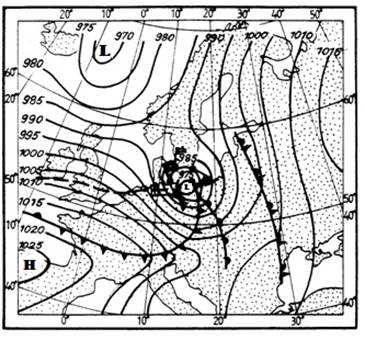
Figure 7: Route of the stormy low pressure center between 19 and 21 October, pressure pattern and wind field over the Southern Baltic Sea on 21 October 1986 at 06 UTC
Development of water levels
On 20 October, water levels on the outer Baltic coast and in Szczecin Lagoon were around normal or slightly below normal. Toward midnight of 21 October the strong onshore winds associated with the low pressure zone that rested over the Pomeranian Bight caused water levels on the outer coasts (which had fallen slightly for a short period of time) to rise moderately at first, and then more quickly. Between 06 UTC and 08 UTC, the gauge stations on the Baltic outer coast recorded peak levels: 608 cm at Koserow, and 590 cm at Świnoujście. Over the lagoon the wind associated with this low had a strong westerly component, pushing the water eastwards towards the Trzebież gauge station, which recorded its maximum value of 544 cm at the same time as the outer coast. As water was pushed out of the western part of the lagoon, water levels at Karnin and Ueckermünde fell to minimum values of 450 cm at Ueckermünde at about 05:20 UTC and 447 cm at Karnin at 06:30 UTC. At that time the difference in water level within the lagoon was about 90 cm and between the western lagoon and the outer coast about 150 cm. After the low-pressure zone had moved across the area, water levels increased, respective fell to values around normal.
This particular case is characterized by relatively rapid changes of water levels. Due to only very narrow connecting channels acting as a low pass filter and helped also by the smaller differences in level between lagoon and outer coast at the main exchange channel, changes in the lagoon and at the outer coast were almost hydrological independent; but clearly connected over the atmospheric forcing.
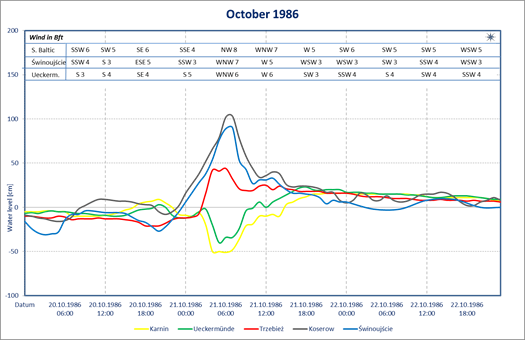
Figure 8: Development of water levels from 20-22 October 1986
November 1992: Large difference between levels on the outer Baltic coast and in Szczecin Lagoon
Meteorological situation
The storm on 25 and 27 November 1992 in the Baltic Sea was proceed on 24 and 25 November by a passage of two successive low pressure troughs, which moved within a strong southwesterly and southerly air flow from over the Atlantic Ocean. The passage of the troughs resulted in moderate to strong offshore winds along the southern coasts in the southern areas of the Baltic Sea. Late on 25 November another depression started from over the Atlantic, rushed towards the English Channel and the North Sea and before the noon on 26 November entered the southern areas of the Baltic Sea. At noon of that day the low centre glided along close to the German and the Polish coast and at 18 UTC was already as far as over Lithuania, where it arrived late on 26 November (18 UTC). The depression remained stormy also after it had reached and crossed the Lithuanian coast. The exceptionally high speed of movement and the relatively small area under the central vortex together with the very steep pressure gradient in its center made this depression resemble a tropical storm. Wind forces were very high, exceeding 8–10 Bft sporadically. However, due to the high speed of passage and the limited dimensions of the depression center the impact of the strongest winds did not keep for long on the route of the low. While the stormy vortex was passing the region around the Szczecin Lagoon on 26 November the southeasterly to southerly wind backed sharply (before the advancing atmospheric front) to northerly, episodically even to northeasterly, directions when the front system passed by.
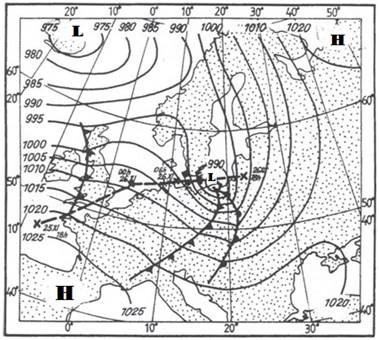
Figure 9: Route of the low pressure center from the 25 to the 26 of November 1992, pressure pattern and wind field over the Southern Baltic at 12 UTC on 26 November
Development of water levels
On 25 November 1992, water levels on the outer Baltic coast and in Szczecin Lagoon were normal or slightly above normal. Then, due to the prevailing offshore wind, water levels fell at the outer coast reaching values around 470 cm toward noon (470 cm in Świnoujście and 472 cm in Koserow). The falling levels at the outer coast had only minor impact on the lagoon, with water level in Trzebież decreasing only slowly and slightly. In the late morning of 26 November, with the advent of the storm, a strong onshore wind in Pomeranian Bay let the water levels rose on the outer coast. As the storm was only of short duration, the maximum water level reached, at around 14 UTC on 26 November, was just 587 cm at Koserow and 565 cm at Świnoujście. As the channels connecting the Baltic with the lagoon act as a lowpass filter almost none of this rapid change had considerable influence on the water levels in the lagoon. As the centre of the storm passed almost along the outer coast, the wind over the Szczecin Lagoon itself had a considerable westerly component, which pushed the water eastwards. Water levels at the Karnin and Ueckermünde in the western part therefore fell rather rapidly while water level at Trzebież in the eastern part rose slowly. The lowest value recorded at Ueckermünde on 26 November was 438 cm at 11:30 UTC and 430 cm at Karnin at 13:30 UTC. Compared to the values at the outer coast, almost at their maximum, this adds up to a difference of about 160 cm between the western Lagoon and outer coast. After the low pressure zone had moved past and the wind abated, water levels on the outer coast as well as in the Szczecin Lagoon quickly fell to normal or slightly above normal values.
This particular case is characterized by rapid changes of water levels. Due to only very narrow connecting channels acting as a low pass filter, changes in the lagoon and at the outer coast were almost hydrological independent; but clearly connected over the atmospheric forcing.
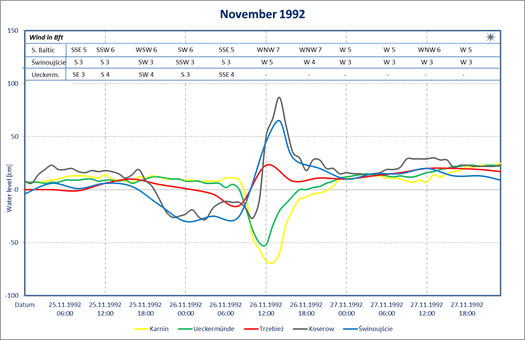
Figure 10: Development of water levels from 25-27 November 1992
February 2002: Large difference between levels on the outer Baltic coast and in Szczecin Lagoon
Meteorological situation
From 17 February to 20 February 2002 a widespread stationary depression with numerous secondary centers occupied the northern areas of the North Atlantic Ocean and the broad adjacent parts of Europe. Some of the secondary depressions were carried within the intensive westerly air flow and penetrated even far southwards onto the European continent.
Over the southern areas of the Baltic Sea prevailed moderate to strong winds of southwesterly to northwesterly direction. On 20 February one of the secondary centers moving swiftly eastsoutheast from over Scotland arrived to Denmark. There the pressure reached the lowest value of 967 hPa and the center began filling, however did not slow down on its way eastwards. On 21 February, about 03 UTC, the low center with 986 hPa was already over northern areas of Poland and continued moving further eastsoutheast, towards Belarus.
About midnight and early on 21 February the very center of the low and the accompanying fronts passed the southern coast of the Pomerania Bay. In effect the wind veered sharply to easterly, northeasterly and northerly directions and the wind force increased rapidly to 7-9 Bft and even to 10 Bft in gusts. In the forenoon the forces decreased for a short time only, the wind directions backing to westerly and southwesterly later. It was due to the fact that in the rear of the retreating low a high pressure ridge arose rapidly, and was steered eastwards. A very steep pressure gradient developed between these two pressure systems and late on 21 February the western parts of the Baltic Sea coast got for a short time under the impact of strong winds, this time from southerly directions. Strong winds lasted as long as to afternoon on 22 February, when the wind forces calmed to moderate and the directions veered to southwesterly.
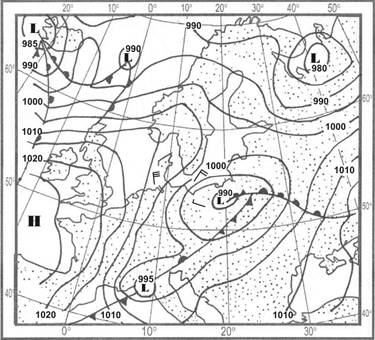
Figure 11: Pressure pattern over Europe and wind field over the Baltic Sea at 06 UTC of 21 February 2002
Development of water levels
On 19 February 2002 the water levels on the outer Baltic coast and in Szczecin Lagoon were already above normal, at around 550 cm. With the strong onshore winds in the morning of 21 February the water levels in Koserow rose quickly to 671 cm at 05:24 UTC. In Świnoujście the highest level of 611 cm was measured on 21 February at 12 UTC. The water level in the lagoon also rose, to values of about 1 metre above normal. Due to the easterly wind component the maximum at Ueckermünde (596 cm) and Karnin (600 cm) was reached earlier (around 07 UTC) then at Trzebież (598 cm at 17 UTC).
As the storm abated, water levels at the outer coast began to fall, the fall intensifying due to the strong offshore winds late on 21 February. The lowest level measured in Koserow was 423 cm on 22 February at 11:23 UTC and in Świnoujście 419 cm at about 13 UTC. The rapid fall of water levels observed on the outer coast was not observed in Szczecin Lagoon as levels in the lagoon decreased only very slowly due to the restricted outflow. On 22 February water levels still were around 550 cm, the difference in water levels between outer coast and lagoon thus being about 130 cm.
On 23 February, water levels in the lagoon continued to fall and levels on the outer coast rose to values around normal.
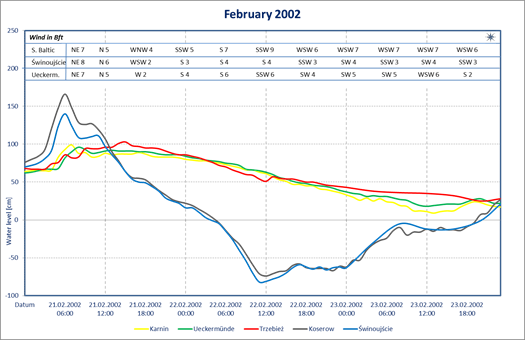
Figure 12: Development of water levels from 21-23 February 2002
April 1995: Large difference within Szczecin Lagoon
Meteorological situation
From the beginning of the month vivid cyclonal activity influenced the Baltic Sea. On 7 April, at about 00 UTC, a low pressure center of 997 hPa appeared north of Shetland Islands and began its way southeast, deepening swiftly. In half a day this center covered the way from the Norwegian Sea across southern Scandinavia and about 15 UTC on 7 April, with the value 982 hPa, entered the Baltic Sea near the island Øland. Here it slowed down considerably, and meandering very slowly, though still slightly deepening, entered the Lithuanian coast at about 03 UTC on 8 April. Meanwhile, in the rear of the low, over Norwegian and North Seas, an anticyclone was in progress from over the British Isles. Pressure gradient between the two centers of action steepened threateningly already at about noon on 7 April, especially over central areas of the Baltic Sea. This steep gradient weakened only slowly during 9 April, as the low, within the 24 hours between 03 UTC on 8 and 03 UTC on 9 April began, hesitantly filling, to retreat over Lithuania, north-eastern Poland and western Belorussia, from where its path backed northeastwards, and north. In the late hours on 9 April this low was still well recognizable near the Lake Ladoga (993 hPa), from where it took its further way north-northwest, across Finland. On its retreat the depression left an elongated trough, so that the isobars over the Baltic Sea retained their north to south direction. According to the development of the described pressure pattern on 7 April, the wind, at first westerly, force 5-7 Bft, and then south-westerly, 6-8 Bft, veered in the afternoon (in the eastern and central areas at first) to west-north-westerly and grew in force to 7-9 Bft. On 8 April northerly and north-westerly winds held on over the Western, Southern and Southeastern Baltic Sea, whereas over the Central and Northern Baltic northerly and north-easterly directions prevailed. Wind force over the whole area varied between 7 and 9 Bft and 10 Bft in gusts. Only in the late hours on 8 April the wind slowly decreased, as the stormy centre hesitantly moved away towards Belorussia. The cold front connected with the depression crossed the area around the Szczecin Lagoon before noon on 7 April. Short before the advancing fronts the calm to moderate southerly to south-easterly wind increased for short to moderate forces. Behind the fronts the wind veered to westerly and north-westerly at times and increased to gale force 7 Bft. Only on 9 April the stormy wind gradually decreased.
Development of water levels
Water levels in Szczecin Lagoon had been slightly elevated for about 5 days prior to 7 April, at 30 cm above mean level. Around 07 UTC on 7 April, the increasing westerly to southwesterly wind started to push the water in the lagoon towards the east, with water levels at Ueckermünde and Karnin falling and at the same time water level at Trzebież rising. This lead, around 21 UTC, to water levels of 482 cm at Karnin, 504 cm at Ueckermünde and 560 cm at Trzebież; a difference of about 80 cm within the Szczecin Lagoon.
After the low pressure zone had moved on, the wind veered to NW first causing increased water levels at the outer coast and then, with a certain time delay due to the narrow passages, also in the Szczecin Lagoon. On 9 April the maximum measured water level was 587 cm at 01 UTC at Trzebież and later, around 01:30 UTC, 589 cm in Karnin and 593 cm in Ueckermünde. Water levels in Szczecin Lagoon remained clearly elevated for several days and did not fall below 550 cm until 14 April
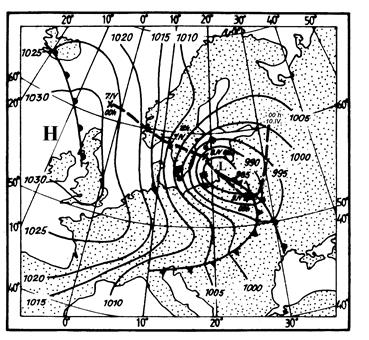
Figure 13: Route of the depression, from 00 UTC on 7 April to 00 UTC on 10 April 1995, pressure pattern and wind field over the Baltic Sea on 8 April 1995, 06 UTC
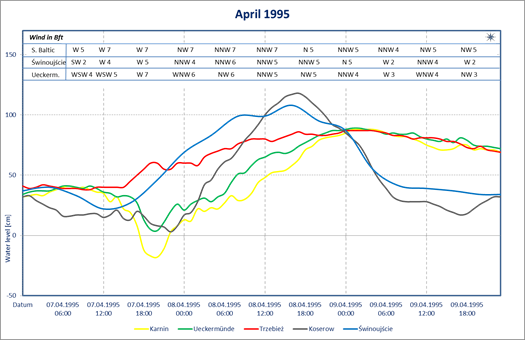
Figure 14: Development of water levels from 07-09 April 1995
March 2001: Large difference within Szczecin Lagoon
Meteorological situation
On 28 March 2001 the Baltic Sea was under the influence of a widespread high with the center 1025 hPa over Latvia. At the same time a widespread depression over Ireland with the center 988 hPa was deepening and moving eastward. Thus, the western outskirts of Scandinavia and the western areas of the Baltic Sea came under the influence of a southerly to southeasterly air flow, which, weak at the beginning, soon grew to moderate and stiff. On 29 March the depression center was already over the North Sea and continued its way towards east, while the high was retreating southeastwards, towards Ukraine. The steering air stream retained though its general south-north course. In the Western Baltic (Cap Arkona, Bornholm) the southeasterly winds slowly increased and reached the value 8 Bft. The area around the Stettin lagoon remained between 27 and 30 March 2001 in the main course of this southerly to southeasterly air flow with nearly steady, moderate offshore southeasterly winds over the Firth and the nearby coastal areas. In the same time near gale winds were reported from over the open, unsheltered waters only somewhat further northwards, off the coast. Over the lagoon, maximum wind forces measured on 29 March only slightly exceeded 5 Bft, while over the open sea the same offshore winds did not decrease below 8 Bft.
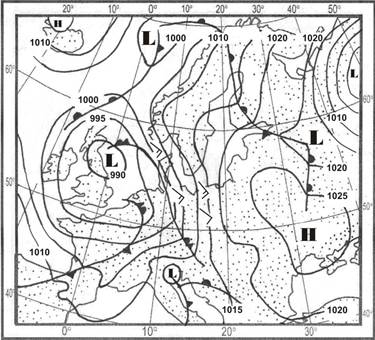
Figure 15: Pressure pattern over Europe and a wind field over the Western Baltic Sea on 29 March 2001 at 06 UTC
Development of water levels
On 28 March 2001, off shore winds led to falling water levels at the outer coast. The water level in Trzebież began to fall slowly at first, then faster until the lowest level of 445 cm was reached on 29 March around 13 UTC. Due to a large easterly wind component, the wind pushed water masses from Trzebież into the western lagoon, and backed-up water caused water levels at Ueckermünde and Karnin to fall very slowly. When the Trzebież gauge station recorded its lowest value, the water level at Ueckermünde still was 479 cm, and at Karnin 488 cm. Water levels in Szczecin Lagoon thus differed by about 35 cm between Ueckermünde and Trzebież, and 45 cm between Karnin and Trzebież.
As the wind decreased toward 13 UTC, the water level at Trzebież began to rise again while levels at Ueckermünde and Karnin continued to fall slowly. On 29 March toward midnight, the minimum value of 470 cm was recorded at Ueckermünde and at Karnin the minimum value of 471 cm was reached toward 02 UTC. Water levels in Szczecin Lagoon remained slightly below normal for several days, and levels near 500 cm were not reached until 7 April.

Figure 16: Development of water levels from 28-30 March 2001
October 2002 Large difference within Szczecin Lagoon
Meteorological situation
On 27 October 2002 about 21 UTC a deep and active depression from over Southern Sweden was deepening and swiftly moving eastwards. At 03 UTC on the next day the center with pressure value 979 hPa was over the Southern Baltic Sea and moved further towards Latvia. Meanwhile a high pressure ridge formed over the British Isles and the Northern Sea. The center of the anticyclone was over France, where the pressure value on 27 October was as high as 1033 hPa. This anticyclone strengthened and spread eastwards, as well. Between these two pressure systems formed a very steep pressure gradient, and a northerly to northwesterly storm developed successively over the western, southern, southeastern and partly central areas of the Baltic Sea. The hurricane-like, gusty winds of force 10 Bft and 11 Bft raged over the whole area, slowly veering and calming only on 29 October. In the Szczecin Lagoon this northerly storm veered and lost a part of its fury. Thus, over the Odra mouth only 6-7 Bft were measured on 27/28 October 2002.
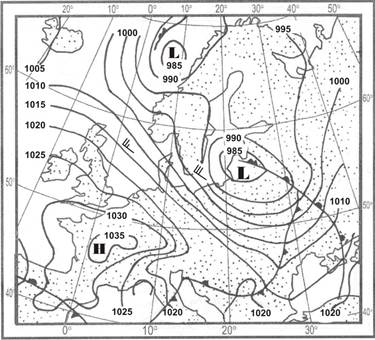
Figure 17: Pressure pattern and accompanying wind field over Europe on 28 October at 06 UTC
Development of water levels
Water levels in Szczecin Lagoon had been up to 30 cm below normal since 24 October. As the wind veered towards westerly and increased to 7 Bft in the early hours of 28 October, water levels in Karnin fell, first slowly and then more quickly, reaching a value of 418 cm. In Ueckermünde, the water level dropped to 437 cm toward 03 UTC. At the same time that levels in Ueckermünde and Karnin were falling, the water level in Trzebież began to rise and reached 516 cm toward 05 UTC. The rising level in Trzebież can be explained by the prevailing westerly winds pushing water masses from Karnin and Ueckermünde eastward toward Trzebież. At almost the same time (between 4.00 and 5.30 UTC) that the lowest values were reached in Ueckermünde and Karnin, the highest value was recorded in Trzebież. The difference between the western and eastern parts of Szczecin Lagoon was about 1 meter: between Trzebież and Karnin 98 cm, and between Trzebież and Ueckermünde 79 cm. In the morning of 28 October, with decreasing wind, the water level in Trzebież returned to values around normal. On the outer coast were no major variations in water level. The values were approximately the mean sea level.
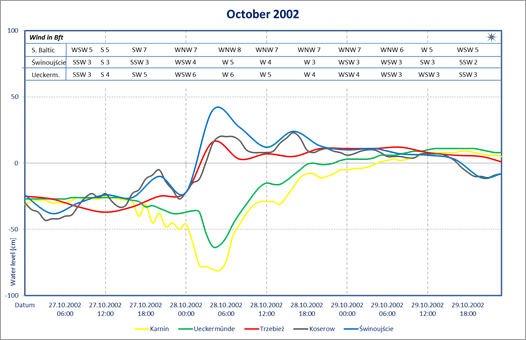
Figure 18: Development of water levels from 27-29 October 2002
December 1977: Low water levels on the outer Baltic coast and in Szczecin Lagoon
Meteorological situation
At the beginning of the period between 23 and 25 December 1977 the whole Eastern Europe was under the influence of a high-pressure ridge with center over Gulf of Finland.
The high slowly retreated southwards, toward the Baltic Sea. A low pressure trough with fronts system from over England progressed northeast, still deepening. At the time the warm front entered Scandinavia, an active low pressure center appeared west of Ireland. This low, quickly moving northeast, reached the Norwegian Sea early on 24 December, crossed central Scandinavia already at noon of this day, while its lowest pressure value was somewhat lower than 975 hPa. Next, veering southeast, the low crossed the Baltic Sea tending towards the Gulf of Riga, to decay further east on 28 December.
According to such development of the pressure field, on 24 December the Southern Baltic Sea was influenced by this wide and deep low pressure trough and remained within a strong air flow from southwest. Before the approaching warm front, the wind temporarily backed to southern and southeastern directions. While the warm sector of the depression was passing through the region during day on 24 December, the pressure gradient steepened considerable, what resulted in rapid growth of the wind force, which reached hurricane values in places. With passing of the cold front late on 24 December the stormy wind veered to west, then northwest and about noon on 25 December calmed down to forces between 5 to 3 Bft.
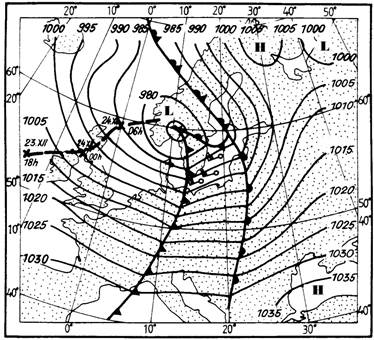
Figure 19: Route of a stormy low center between 23 and 25 December, pressure pattern and wind field over the Southern Baltic Sea on 24 December 1977 at 12 UTC
Development of water levels
On 23 December the water levels on the outer coast and in the Szczecin Lagoon were, due to the light S - SW – winds, at or slightly below the mean sea level. On 24 December, due to the increasing offshore winds, the water levels at the coast and in the Szczecin Lagoon began to fall. In the Szczecin Lagoon, the water levels reached their lowest values in the afternoon of 24 December (Ueckermünde 442 cm at 14 UTC and Karnin 420 cm at 13:30 UTC). In Trzebież only a very slight decrease was registered (475 cm on 25 December at 01 UTC). On the outer coast, the lowest water levels were measured on 24 December at 20 UTC (Koserow 420 cm and Świnoujście 415 cm). Afterwards, the wind veering to onshore, the water levels on the outer coast began to rise rapidly and reached values of about 550 cm around noon of 25 December. The water levels in the Szczecin Lagoon rose only slowly. Around 26 December 00 UTC the water level values in the Szczecin Lagoon and on the outer coast were back to mean sea level.
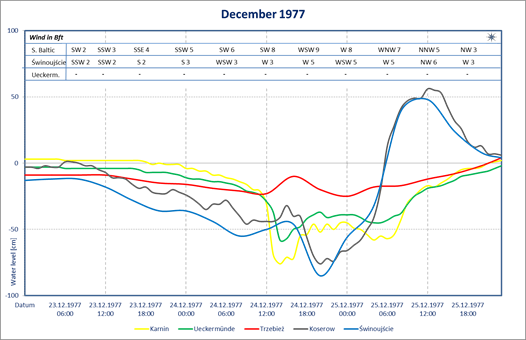
Figure 20: Development of water levels from 23-25 December 1977
October 1991 Low water levels on the outer Baltic coast and in Szczecin Lagoon
Meteorological situation
On 16 October an active, widespread and deep depression with pressure of 960 hPa of Scotland covered North Atlantic, Iceland, Norwegian and Greenland Sea and the British Isles and moved southeast. One day later the huge low pressure area covered almost whole Europe. This low however was followed by growing high pressure which was entering from the northwest, so that already late on 17 October values exceeding 1030 hPa could be observed over western Iceland. This resulted in a very steep pressure gradient, which was accompanied by growing stormy winds all over the seas adjacent to the northwestern European coasts. At that time the much elongated low center, while entering the western coast of Scandinavia, began slightly filling and broke into two separate parts. The pressure value in each of these parts did not exceed 975 hPa. The southern center, which formed over the Skagerrak, later decreased its propagation speed and early on 18 October began backing across southern Scandinavia and the Central Baltic Sea towards the entrance of the Gulf of Finland and further northeastwards, where it slowly decayed.
In the coastal zone of the western and southern Baltic Sea the stormy winds, generated by the described pressure system, oscillated between SSE and SW directions, veering gradually and persisting for some days after the passage of the depression center.
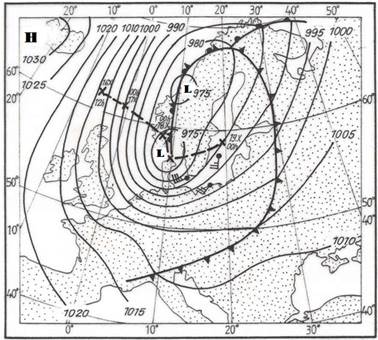
Figure 21: Route of the stormy depression from 16 to 19 October 1991, pressure pattern and wind field over the Baltic Sea on 18 October, 06 UTC
Development of water levels
Already before the storm, water levels were below normal. With the storm approaching water levels on the coast and in Szczecin Lagoon began to fall in the morning of 17 October due to the offshore winds. The decrease was quite continuously, reaching minimum values at the outer coast of 415 cm in Koserow and 408 cm in Świnoujście (both on 18 October at about 10 UTC). Toward noon, the wind veered towards more westerly direction and water levels on the Baltic outer coast began to rise. The westerly wind component induced further falling water levels in the western lagoon, while the levels at Trzebież in the east stayed almost flat. In the lagoon the lowest water levels were recorded in the evening of 18 October: 458 cm in Trzebież at 18 UTC, 438 cm in Ueckermünde at 20:10 UTC and 432 cm in Karnin at 21 UTC. With increasing onshore winds water levels at the outer coast rose to 534-540 cm on 19 October, while water levels in the lagoon increased slowly but steadily to normal values.
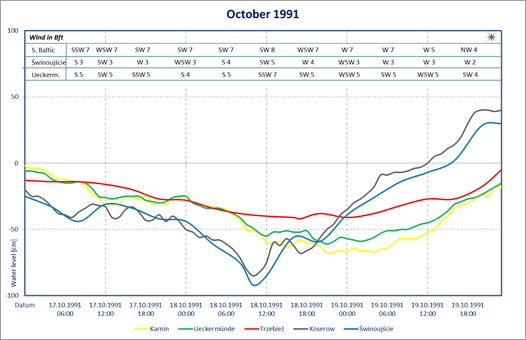
Figure 22: Development of water levels from 17-19 October 1991
January 1993 Low water levels on the outer Baltic coast and in Szczecin Lagoon
Meteorological situation
On January 13, an anticyclone prevailed over the European continent, with maxima above 1030 hPa over the Alps. A low-pressure system consisting of two depressions persisted to the north of this system. The first was located over the Norwegian North Sea with its center at 960 hPa, and the second over the White Sea with its center at about 955 hPa. This quasi-stable configuration of the pressure pattern forced a strong southwesterly air flow, which overlapped the conditions in the western wind zone and ensured strong westerly and southwesterly winds from the British Isles to Russia throughout the day. Driven by this air flow, a young and active depression with a frontal system approached the British Isles early on 13 January. The rapidly deepening depression reached Denmark late on 13 January, moved quickly across southern Scandinavia and the central Baltic Sea, crossed southern Estonia, and entered Russia late on 14 January, where it slowed and began to fill early on 15 January. However, the storm stopped before noon, when a ridge of high pressure from the anticyclone over the Alps spread across the Baltic Sea.
In addition to an unusually fast forward motion, this stormy low pressure system of January 13-14 also generated a significant storm along its track. By late January 13 and the following night, the storm was already raging over the southern and central parts of the Baltic Sea. The winds first backed slightly in front of the advancing fronts, increasing to 9-10 Bft, veering and gusting to 12 Bft behind the cold front, which soon passed.
In the early hours of 14 January, the trough left the Baltic Sea and winds decreased slightly. However, the storm did not calm down until the morning of 15 January.
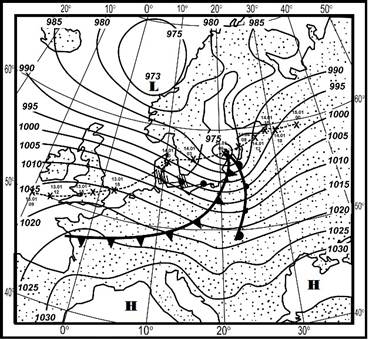
Figure 23: Route of the depression center, pressure pattern over Europe and wind field over Baltic, on 14 January 1993 at 06 UTC
Development of water levels
Due to the persistent southwesterly flow, sea levels had already been lower than normal in the days before 13 and 14 January 1993. As the storm approached, the offshore wind abated and, with a more alongshore/onshore pattern on the outer coast, water levels on the outer coast rose briefly. The westerly wind component pushed the water in the Szczecin Lagoon eastwards, causing water levels to fall at Ueckermünde and Karnin, and to rise on the outer coast and at Trzebież.
When the storm arrived, water levels on the outer coast and at Trzebież also began to fall. In the lagoon, the minimum was reached at Karnin (420 cm) at about 03 UTC on 14 January, and at Ueckermünde (435 cm) at about 05 UTC. On the outer coast, the minimum was recorded around noon (402 cm at Koserow), after which sea levels on the outer Baltic coast rose rapidly but very unevenly. Water levels in the lagoon rose very slowly, reaching normal values only on 15 January.
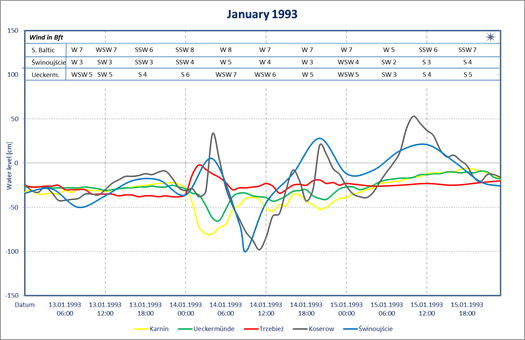
Figure 24: Development of water levels from 13-15 January 1993
Water gauge Świnoujście
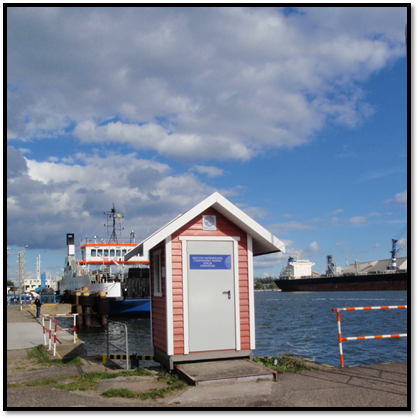
Figure 25: Water gauge station in Świnoujście (Photo IMGW)
The water gauge is located on the left side of the Świna river canal, opposite to the Harbor Master. Gauge with range from 360 cm to 660 cm mounted to the pier in the harbor. Latitude - 53° 54' 30", longitude - 14° 15' 52". There is also a mareograph beside water gauge.
The water gauge in Świnoujście was established in 1810 with the gauge zero of -1.074 NN. Since 11.01.1936 the water levels referred to gauge zero -5,000 NN, since 03.06.1947 the observations were resumed and gauge zero was set at -5,000 NN, which correspond to -5.084 Kr.
Mareograph started on 3 May 1957.
Automatic telemetry station established on 19.05.2004 and a year later regular observations were started.
Tab. 1 Characteristic water levels for the water gauge in Świnoujscie
|
Location |
gauges zero level |
Warning |
HW |
MW |
LW |
Abs. Max (1951 – 2012) |
Abs. Min (1951 – 2012) |
|||
|
cm |
date |
cm |
date |
|||||||
|
Bałtyk |
-5,08 m Kr |
-5,00 m N.N. |
560 / |
669 |
500 |
366 |
696 |
10.02. |
366 |
18.10. |
|
669 |
04.11. |
|||||||||
Water gauge - Trzebież
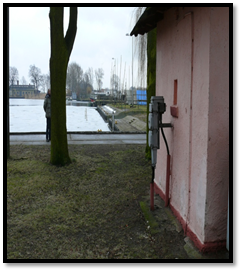

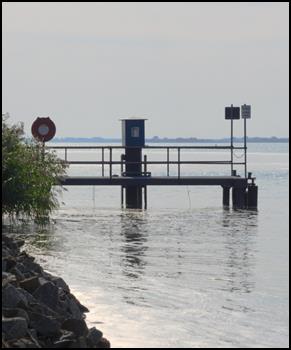
Figure 26: Water gauge Trzebież (photo IMGW)
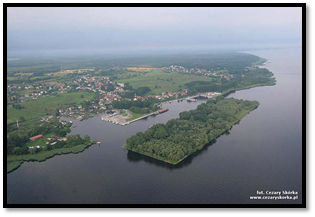
Figure 27: Trzebież Harbor and a view on the Szczecin Lagoon (photo by C. Skórka, according to website)
The water gauge is located in the fishing harbor, near port Bosun. A gauge with range from 360 cm to 660 cm is in the corner of the pool. Latitude - 53 ° 39 '32 ", longitude - 14 ° 31' 06". Near water gauge is located a mareograph.
The gauge in Trzebież established in 1884. The gauge zero level was then -0.797 m NN. Since 1936, water levels related to the gauge zero -5,000 m NN, which corresponds to -5.080 Kr (Kronsztadt).
Tab. 1 Characteristic water levels for the water gauge in Trzebież
|
Location |
gauges zero level |
Warning |
HW |
MW |
LW |
Abs. Max (1951 – 2012) |
Abs. Min (1951 – 2012) |
|||
|
cm |
date |
cm |
date |
|||||||
|
Zalew Szczeciński |
-5,08 m Kr |
-5,00 m NN |
540 / |
626 |
507 |
429 |
637 |
31.12. |
428 |
21.03. |
|
626 |
15.10. |
429 |
25.02. |
|||||||
Water gauge - Karnin
![]()
![]()
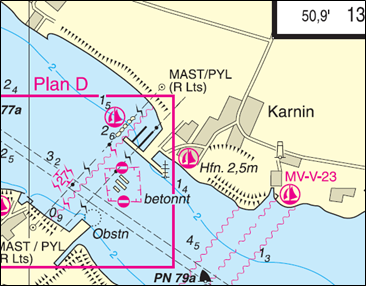
The gauge Karnin is located on the left shore side of the port „Der Strom“ in the estuary of the Little Lagoon (53°50'37"N,13°51'31"E).
Location: Little Lagoon – Peenestrom Zero level: PNP = NHN – 5.14 m
Since 1928 observations have been made for this gauge.
Highest
high water level (HHW): 6.38m on 31.12.1913
Lowest low water value (NNW): 4.09m on 12.11.1914 (06.11.1911?)
Probability of the recurrence T of storm surges and / or low water.
|
T (in years) |
2 |
5 |
10 |
20 |
40 |
50 |
80 |
100 |
|
HW-value (in m) |
5.83 |
5.87 |
5.98 |
6.09 |
6.20 |
6.23 |
6.30 |
6.33 |
|
NW-value (in m) |
4.43 |
4.31 |
4.22 |
4.14 |
4.06 |
4.04 |
3.99 |
3.96 |
Poisson statistics are used for periods of 2 years, and
Gumbel statistics are used for periods >= 5 years periods.
T- Recurrence in years
HW – Storm surge value in meters (deviation from mean sea level)
NW - Low water value in meters (deviation from the mean sea level)
Water gauge – Ueckermünde
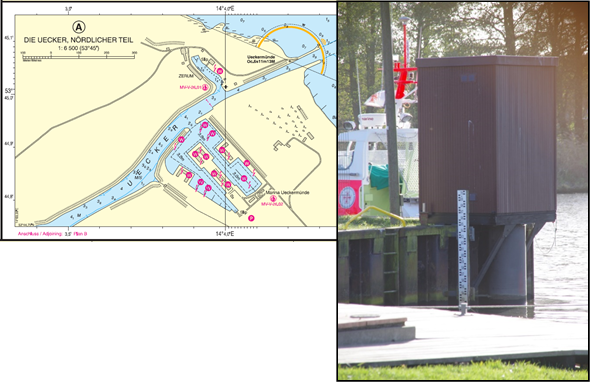
![]()
Figure 31 Gauge Ueckermünde
The gauge Ueckermünde is located on the left bank of the river Uecker (53°45'01''N, 14°03'59''E).
Location: Little Lagoon – Ücker Zero level: PNP = NHN – 5.14 m
Since 1947 observations have been made for this gauge.
Highest
high water level (HHW): 6.24m on 15.10.2009
Lowest low water value (NNW): 4.32m on 20.12.1993
Probability of the recurrence T of storm surges and / or low water
|
T (in years) |
2 |
5 |
10 |
20 |
40 |
50 |
80 |
100 |
|
HW-value (in m) |
5.88 |
5.92 |
6.03 |
6.14 |
6.24 |
6.27 |
6.34 |
6.38 |
|
NW-value (in m) |
4.54 |
4.45 |
4.38 |
4.32 |
4.25 |
4.23 |
4.19 |
4.16 |
Poisson statistics are used for periods of 2 years, and
Gumbel statistics are used for periods >= 5 years periods.
T- Recurrence in years
HW – Storm surge value in meters (deviation from mean sea level)
NW - Low water value in meters (deviation from the mean sea level)
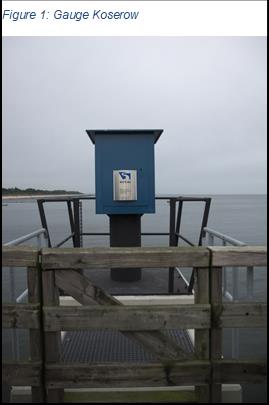
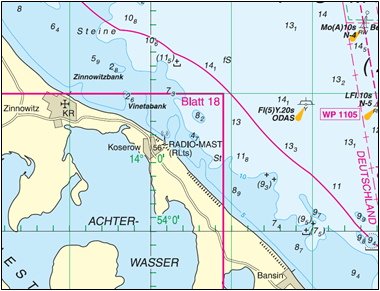
Water gauge - Koserow
![]()
 The
gauge Koserow is located on the left side of Koserow Pier (54°03'37'' N,
14°00'03'' E).
The
gauge Koserow is located on the left side of Koserow Pier (54°03'37'' N,
14°00'03'' E).
Location: Baltic Sea – Island Usedom – Pier Zero level: PNP = NHN – 5.14 m
Since 1973 observations have been made for this gauge.
Highest
high water level (HHW): 6.83m on 03.11.1995
Lowest low water value (NNW): 3.64m on 04.12.1999
Probability of the recurrence T of storm surges and / or low water
|
T (in years) |
2 |
5 |
10 |
20 |
40 |
50 |
80 |
100 |
|
HW-value (in m) |
6.32 |
6.48 |
6.65 |
6.82 |
6.98 |
7.03 |
7.14 |
7.19 |
|
NW-value (in m) |
4.17 |
4.31 |
4.22 |
4.14 |
4.06 |
4.04 |
3.99 |
3.96 |
Poisson statistics are used for periods of 2 years, and
Gumbel statistics are used for periods >= 5 years periods.
T- Recurrence in years
HW – Storm surge value in meters (deviation from mean sea level)
NW - Low water value in meters (deviation from the mean sea level)
Changes
in the document:
2014 First PDF version;
2020/2024 applied some formatting changes without content change
2024 made a HTML Version