| Plattform Platform |
Reise-Nr. Cruise-No. |
Zeitraum Period |
Projekt Project |
Arbeitsgebiet Working area |
|---|---|---|---|---|
| Solea | 768 | 01.10.2019 - 21.10.2019 | BIAS GERAS |
Baltic Sea ICES-Subarea 21 ICES-Subarea 23 (also ICES-subarea IIIb) Kattegat ICES-Subarea 22 (also ICES-subarea IIIc) Arkona Basin |
| Fahrtleiter Chief Scientist | Institut Institute | Auslaufhafen Port of departure | Einlaufhafen Port of return | Stationskarte Station map | Schiffsroute Trackchart |
|---|---|---|---|---|---|
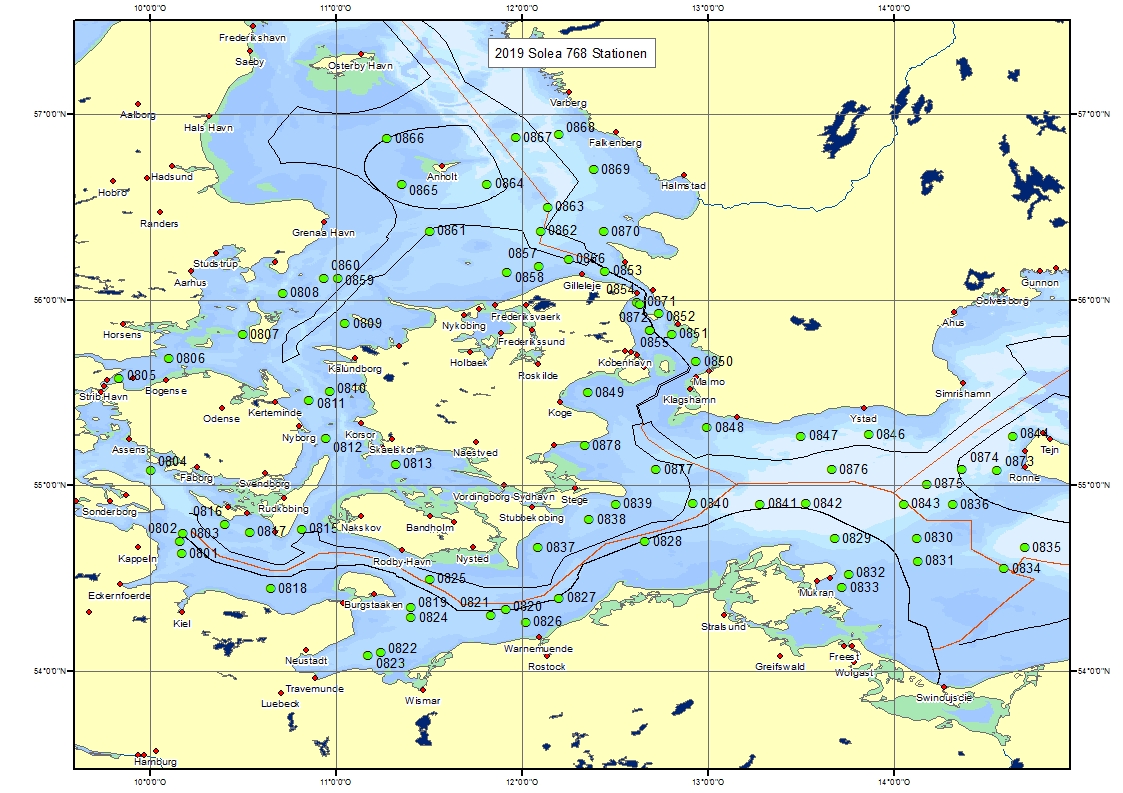
| Schaber Matthias | Thunen-Institut fur Ostseefischerei | Kiel | Rostock | Karte Map |
Ziel der Reise / Objectives of Cruise:
The cruise was part of an international hydroacoustic survey providing information on stock parameters of small pelagics in the Baltic Sea, coordinated by the ICES Working Group of International Pelagic Surveys (WGIPS) and the ICES Baltic International Fish Survey Working Group (WGBIFS). Further WGBIFS contributors to the Baltic survey are national fisheries research institutes of Sweden, Poland, Finland, Latvia, Estonia and Lithuania. FRV "Solea" participated for the 32nd time. The survey area covered the western Baltic Sea including Kattegat, Belt Sea, Sound and Arkona Sea (ICES Subdivisions (SD) 21, 22, 23 and 24). Altogether, 1124 nautical miles of hydroacoustic transects (plus 103 nmi night and daytime transects for comparison) were covered. The survey effort was comparable to 2018 with a slightly reduced coverage in SD 21. In roughly half of all sampled rectangles, mean NASC values per nautical mile were either comparable with or higher than the values measured in 2018, and lower in the remaining rectangles. Compared to the long-time survey mean however, mean NASC values in the large majority of rectangles covered were distinctly lower. On ICES subdivision scale, mean NASC values were overall lower than in the previous year in subdivision 21, slightly higher in SD 22, distinctly lower in SD 23 and almost identical to 2018 in SD 24. For species allocation and identification, altogether 45 fishery hauls were conducted. Vertical hydrography profiles were measured on 76 stations.
Messungen / Measurements
| Institut Institute |
Wissenschaftler Scientist |
Anzahl Number |
Einheit Unit |
Typ der Messungen Type of measurements |
Kommentar Comments |
Daten im DOD Data in DOD |
|---|---|---|---|---|---|---|
| VTISF | Schaber Matthias | 45 | hauls | B14 Pelagic fish |
- | no |
| VTISF | Schaber Matthias | 2082 | km | B28 Acoustic reflection on marine organisms |
- | no |
| VTISF | Schaber Matthias | 76 | stations | H00 Stations |
- | yes |
| VTISF | Schaber Matthias | 76 | profiles | H10 CTD-Stations |
- | no |