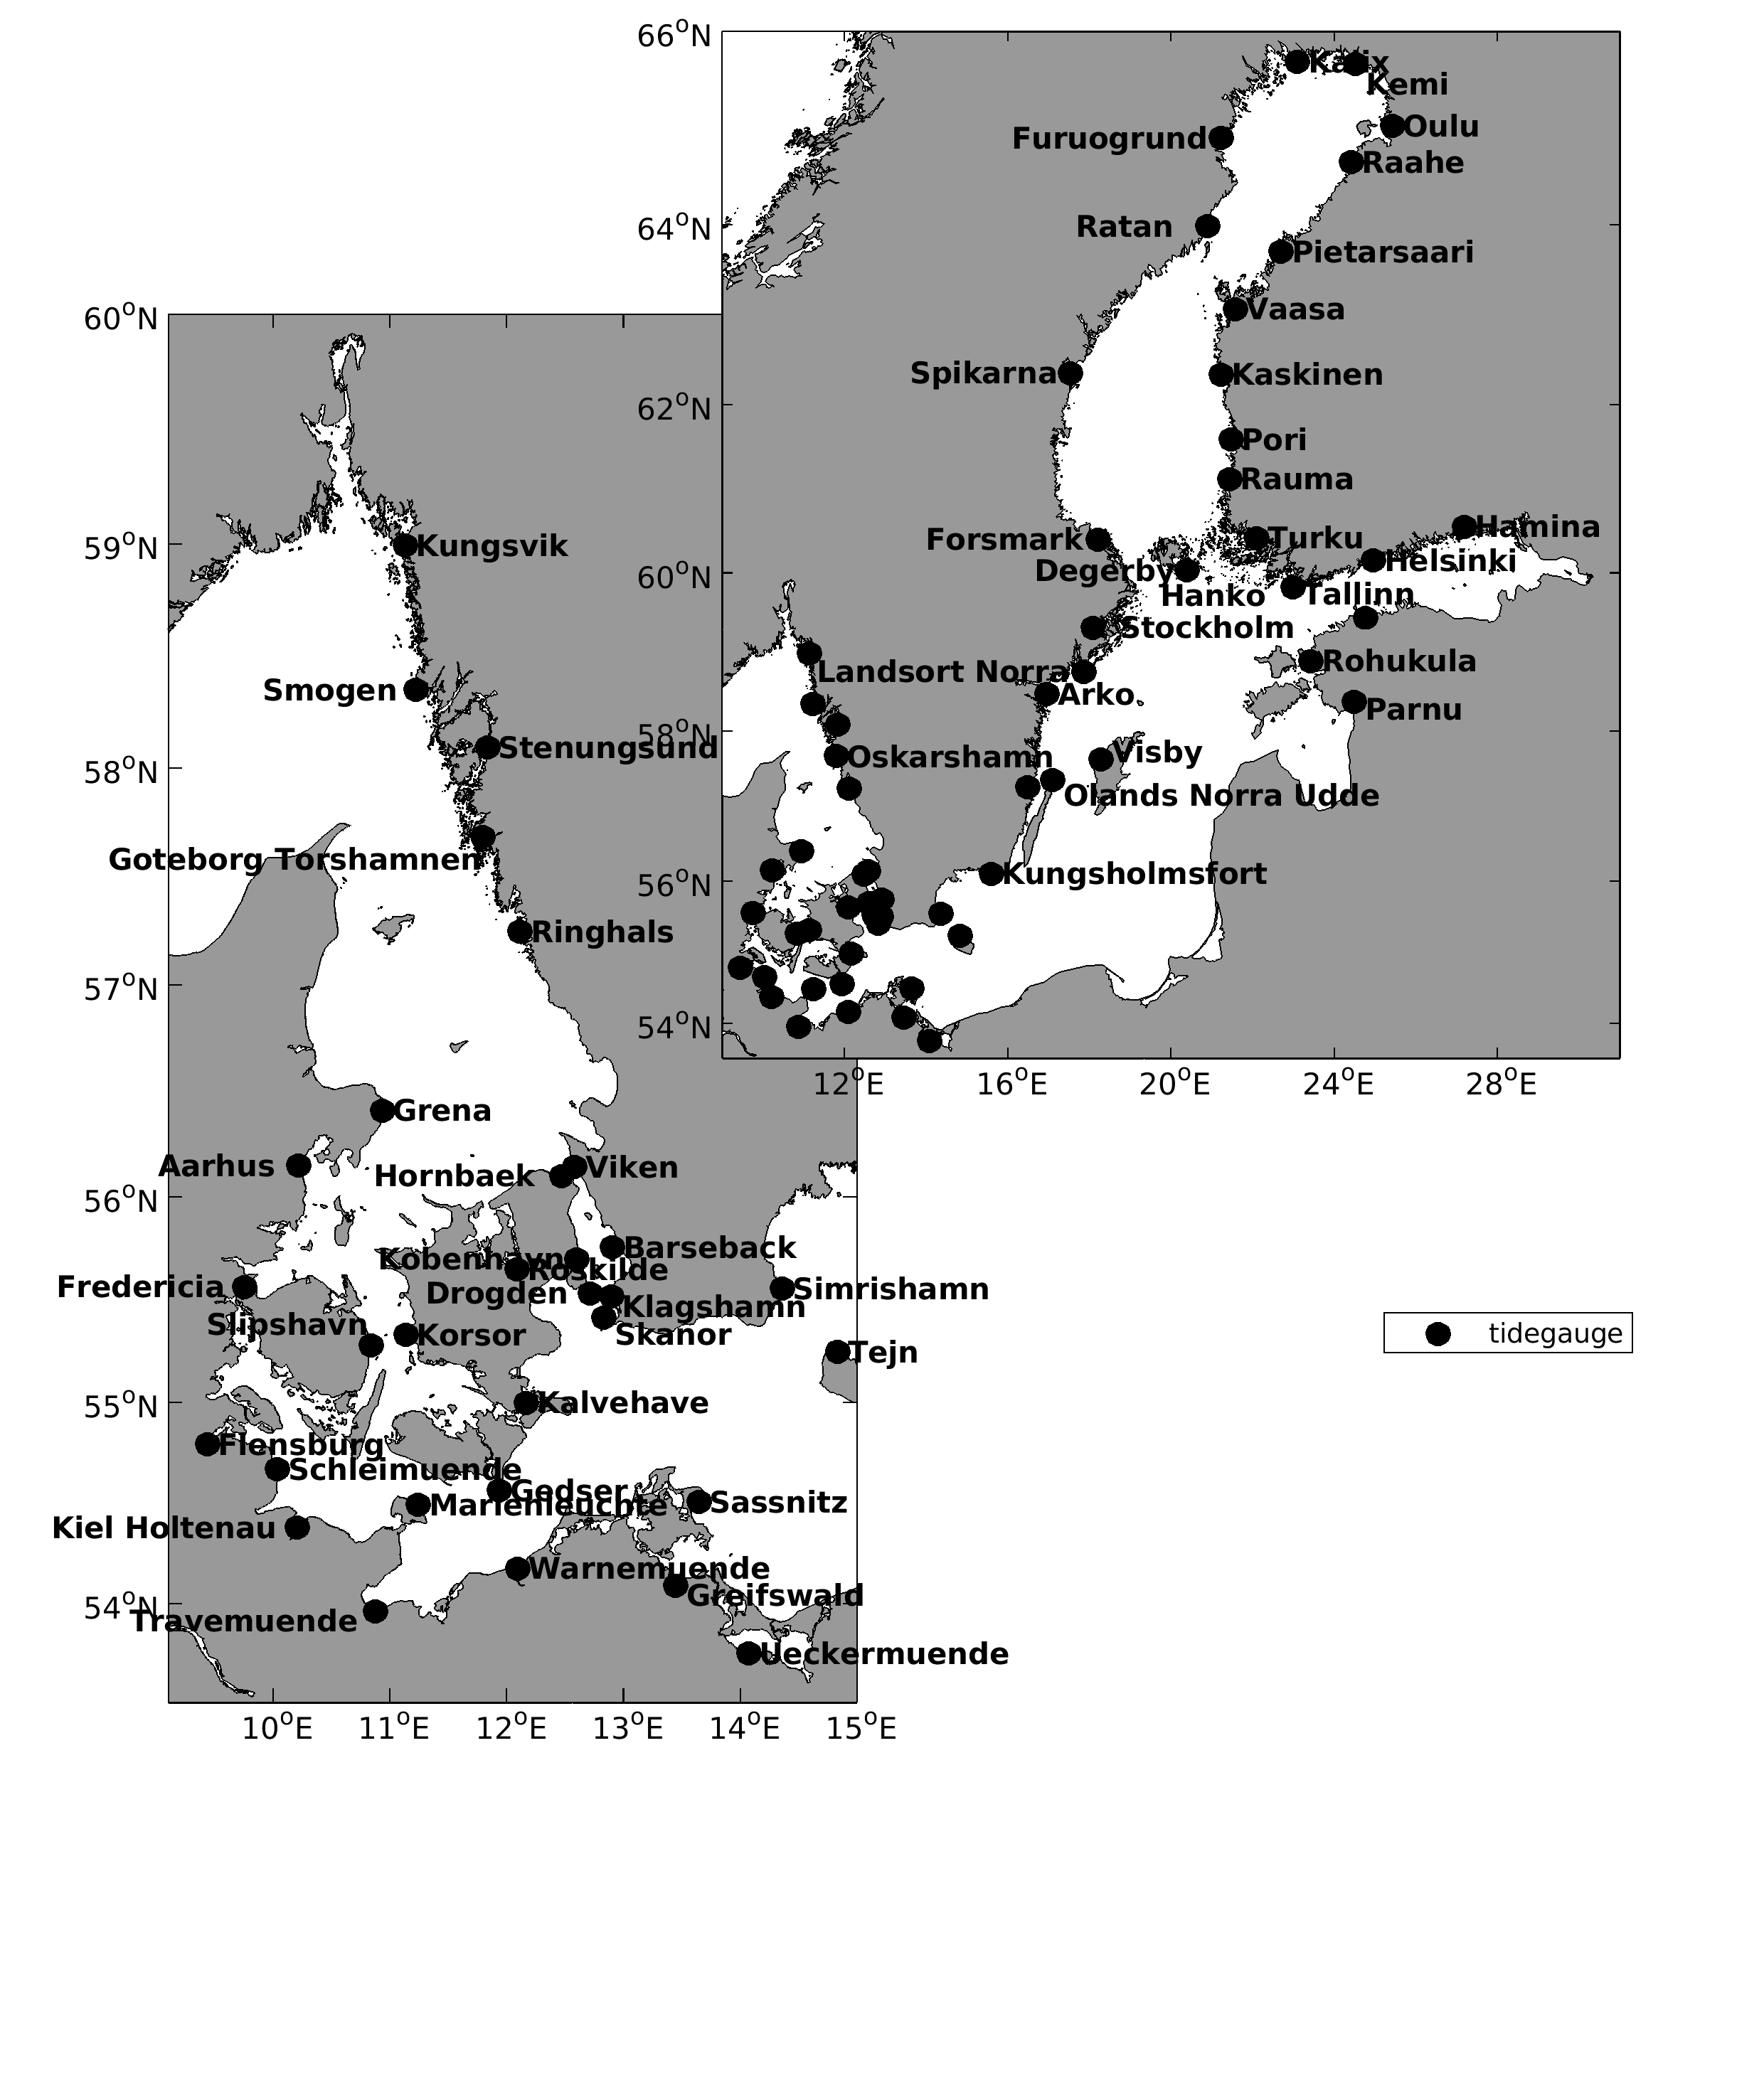
The water level forecasts from each ensemble member are compared with the MME weighted mean. The time period of this comparison is chosen to be the first 24 hours of the last 2 days' forecasts (on the grey background) and the current 48h-forecast (on the white background). If there is a "*" behind the RMSE values, it indicates that the bias is derived using previous forecasts and observations, which are not shown in the figure. Otherwise, the bias is the averaged difference between the first 24 hours of the last 2 days forecasts and observations.
Click on the station name for water level forecast comparison with MME partners. (opens a new tab)
